Connect 10 million × 5 kW = 50 GW of DER through one control plane and a single cloud compromise moves 35 GW at once; certification that cuts the compromise probability tenfold does not change the outcome. Connect them through independent domains with a device-side output floor and authority caps and the same compromise moves 117 MW. But once the number of attack surfaces and the shared vendor firmware-line channel are counted, software-only distributed autonomy is no safer than centralization. What lowers total risk is an output floor held by a monitor circuit independent of the main firmware, and a cap on the capacity one firmware line can reach remotely (about 1,350 MW in the reference grid); a server-side aggregate cap brings the centralized design to the same order. The question is not how many units are certified, but how many GW one attacker can move at once.
Version 1.0 (2026-10-07) — I-S3 Special Research Project — Author: Suomi Masuda
Summary
- Since the probability of a breach cannot be driven to zero, the cyber-safety of a power grid must be measured not by "never being breached" but by "continuing to function when breached". This article defines Cyber Blast Radius (CBR) — the generation or consumption capacity (MW) that one compromise can move simultaneously — and decomposes it by device, domain, firmware line, control plane and region. The logic is that of NERC CIP-002's 1,500/3,000 MW thresholds and the EU Network Code on Cybersecurity's ECII, brought down to distribution-level DER and the device.
- Systemic risk is defined as the annual probability, for the whole fleet, of a wide-area event (under-frequency load shedding or worse), counting both the control-plane compromise channel and the vendor channel (cloud/OTA/firmware). We compare 10 million × 5 kW = 50 GW connected (A) through a single control plane with device certification, and (B) through 100 independent domains with a device-side output floor (envelope) and per-domain authority caps.
- For the same control-plane compromise, A moves 35 GW and the grid collapses; B stops at 117 MW. But B has 100 times the attack surface: the probability that some domain is compromised in a year is 63%. Even so, control-plane-channel risk in B is about one-seventh of certified A (Monte Carlo median one-fourteenth). The effect of splitting plus device constraints is one to two orders of magnitude — not the five orders estimated in the draft.
- In total, software-only B is no better than A. When a vendor's firmware line (largest share 30% = 10.5 GW) is compromised, the per-domain authority cap is bypassed and an envelope implemented in firmware disappears. This channel is shared by A and B and dominates total risk (B 1.9×10⁻²/yr, A 2.8×10⁻², certified A 9.4×10⁻³). The linear expected affected capacity does not fall with splitting either.
- Two measures lower the total: (1) holding the output floor in a monitor circuit independent of the main firmware (a 30% floor survives a firmware compromise; the ramp limit does not), and (2) capping the capacity one firmware line (same signing key, same OTA path) can reach remotely. To avoid load shedding in the reference grid the cap is about 1,350 MW (11.5% of the fleet) if the floor survives, about 3.9% if software-only. B with both measures totals 4.0×10⁻³ (12% cap) to 1.3×10⁻³ (5% cap).
- Centralization reaches the same order. A+ — a single plane with an independent server-side safety monitor enforcing an aggregate cap (1,500 MW per window) and staged rollout — bounds an API-credential compromise and totals 3.1×10⁻³. What remains is a full-backend compromise. In the Monte Carlo, B with the independent monitor and reach cap is lower than A+ in 83% of draws, with a median ratio of only 3.3.
- The conclusion is not "distribution is safe". Writing a cap on the MW behind one credential and one firmware line comes before the choice of architecture. The cap can sit on the device side (floor held by an independent monitor) or the server side (aggregate cap). Putting it on both is the cheapest insurance.
- Conditions under which centralization wins also exist: a fleet small relative to the grid; a vendor channel relatively more likely than the plane channel; a small, hard-to-bypass server-side cap; and an x already so small that the gain from splitting loses to the multiplied attack surface.
- Proposed policy indicators: Cyber Blast Radius, Maximum Remote Authority (MW per credential), remote reach per firmware line, settings-authority reach, device-side command rejection (decomposed into auditable attributes), vendor concentration. The question is not "how many units are certified" but "how many GW can one attacker move at once".
- Model, data, code, the Red Team's objections and our responses are all public (CC BY 4.0), and the in-article simulator lets readers check the result with their own numbers.
1. The question: what do we design when we cannot defend?
Solar inverters, home batteries, EV chargers, heat pumps. Each is a few kilowatts, but in Japan alone residential solar exceeds 3.4 million systems, cumulative PV capacity passed 100 GW, and home batteries reached about 1 million units (data: der_fleet_japan.csv). Add EVs and heat pumps in the 2030s and tens of millions of devices will be remotely adjustable.
Almost all of them connect to a cloud — for monitoring, curtailment, balancing-market participation, firmware updates. Every reason is legitimate. And in 2024–2025, defects on the cloud side were published one after another.
- In the Solarman/Deye monitoring and control platform, token signatures were not verified and credentials were hard-coded; researchers confirmed they could change settings on about 2 million plants, 10 million devices and 195 GW (fixed after disclosure) [I01].
- Forty-six vulnerabilities in Sungrow, Growatt and SMA products and clouds allowed account takeover through to remote inverter control [I02].
- All nine inverters tested by the Dutch regulator failed its cyber requirements [R07].
None caused harm. That is not evidence of safety; it means the defects were fixed before publication and that no grid attack through a DER cloud has yet been observed (Figure 12). Attacks on grids themselves already exist: Ukraine's distribution and transmission control systems were attacked in 2015 and 2016 [I05], substation-targeting malware reappeared in 2022 [I08], and pre-positioning in US critical infrastructure including power has been disclosed [I09]. DER clouds are untouched as a matter of sequence, not capability.
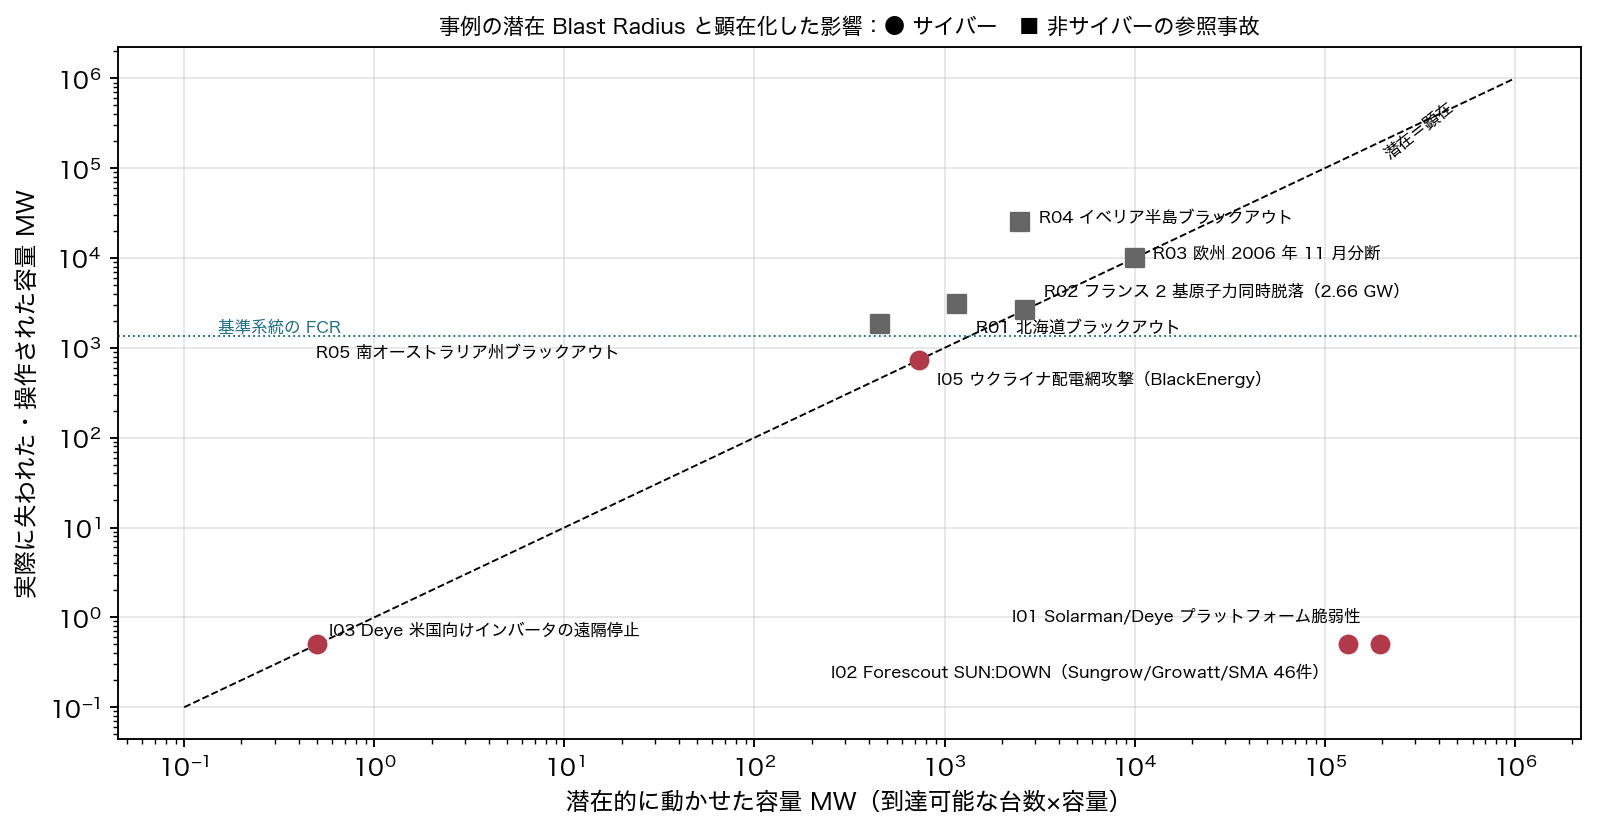
The standard answer is "defend harder": stronger authentication, encryption, device certification, cloud monitoring. All necessary. But this article asks a different question.
When the defence is breached, how many MW move at once — and who decided that number?
To answer it we define Cyber Blast Radius and compare two ways of connecting DER against the same attack on the same grid model. The conclusion is not fixed in advance; the conditions under which distributed autonomy loses are written with equal weight. Before publication we put two independent review teams to work and asked, from nine perspectives, "where would the best researcher who disagrees with this attack it?" Many of their objections were right, and the numbers changed substantially. Their objections and our responses are published in full (review/red_team_report.md, review/final_response_matrix.md).
2. Security and resilience are different quantities
Security lowers the probability of compromise. Authentication, cryptography, vulnerability management, penetration testing, certification all act here.
Resilience shrinks the consequence of a compromise: how far it spreads, how long recovery takes, what keeps working meanwhile.
They multiply into systemic risk:
Multiplication matters. Cutting P to one-tenth while Consequence grows a hundredfold raises risk tenfold. And that is what is happening: alongside efforts to lower P, the capacity behind one credential is growing by gigawatts.
3. Why "certified = secure" does not hold
Device certification (Japan's JC-STAR, the EU RED cyber requirements, IEC 62443 product certification) confirms design-time compliance. It lowers P. Three things remain unchanged by the label.
- Change in operation. Leaked keys, missed revocations, unpatched firmware, departed employees' credentials.
- Outside the device. In Solarman/Deye and SUN:DOWN most defects were in cloud APIs and account management [I01][I02]. IEEE 1547-2018 notes the importance of cybersecurity in §10.9 without requirements; 1547.3-2023 is a guide [S01][S02].
- Size of authority. If 10 million certified devices obey the same cloud, an attacker holding that cloud's legitimate authority commands 10 million devices. Certification tells a legitimate command from a forged one; it does not ask whether a legitimate command is large enough to break the grid.
We do not reject certification. The model includes its reduction of compromise probability (p_reduction_cert, default 3×, sensitivity 1–10×) and applies the same factor to both the centralized and the distributed design. What we reject is the inference "certified, therefore the grid problem is solved".
4. From one device to ten million: scale changes the problem
5 GW is four to five large nuclear units, more than all of Hokkaido's demand on 6 September 2018 (3,090 MW). Behind one credential, that credential weighs as much as the emergency-stop buttons of five nuclear plants.
DER also act simultaneously. Power stations fail one at a time; a cloud command reaches 10 million devices in seconds. What a grid can absorb depends on the speed of a change as well as its size. In a low-inertia grid a few GW of step change drives frequency into the load-shedding band within seconds (Section 13).
So the problem moves from "how do we protect each device" to "what structure do we permit in which one compromise moves N MW at once".
5. Defining Cyber Blast Radius
Definition. Cyber Blast Radius (CBR) is the generation or consumption capacity (MW) an attacker can move simultaneously within the critical time window (from inertial response to full primary reserve, about 30 seconds) after one successful compromise.
| Unit | Definition | Reference case (10 million × 5 kW = 50 GW) |
|---|---|---|
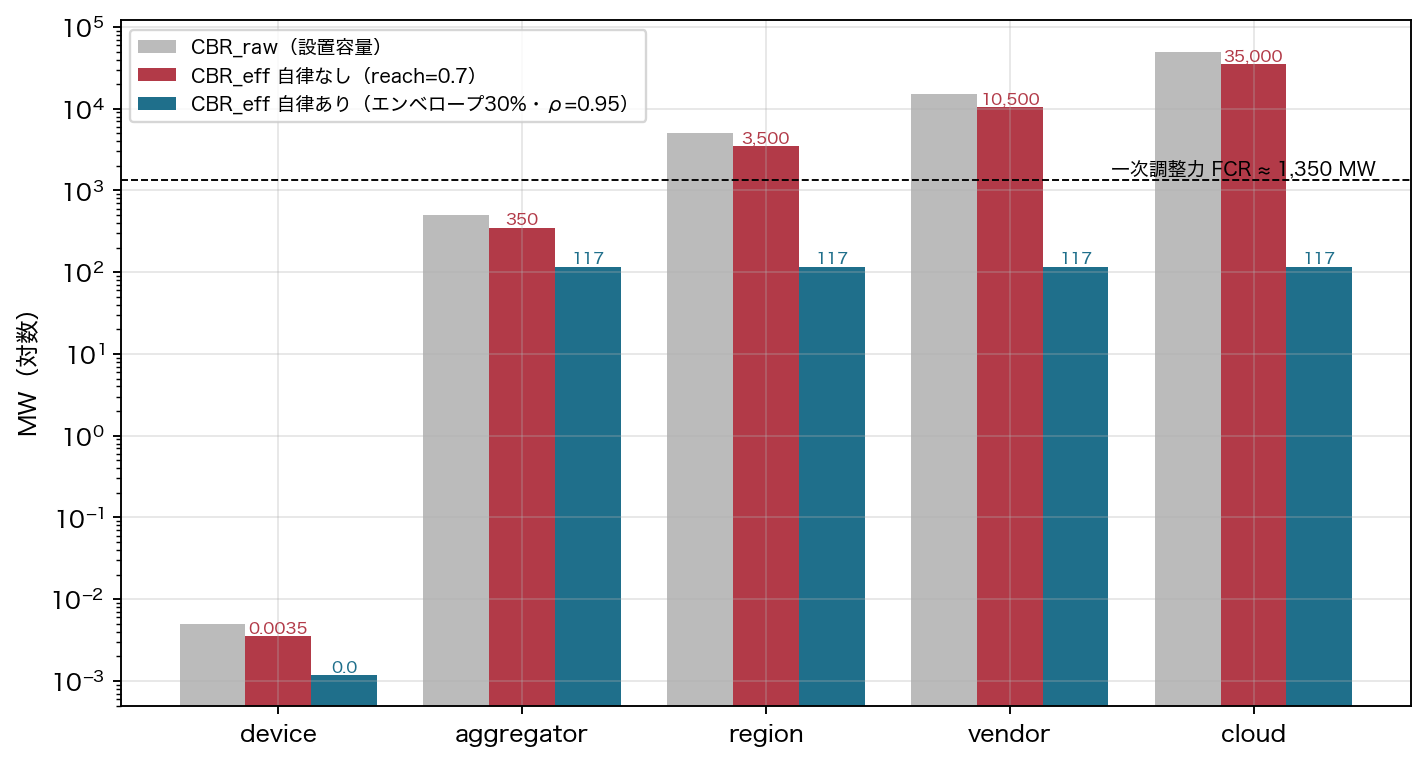
| CBR_device | One device | 0.005 MW |
| CBR_domain | One aggregator / control-domain credential | 500 MW (100 equal domains) |
| CBR_vendor | One firmware line (same signing key, OTA path, cloud) | 15,000 MW (largest share 30%) |
| CBR_cloud | National control-plane credential / API | 50,000 MW |
| CBR_region | Reachable capacity in one grid area | Installed capacity of the area |
This is the "raw", installed-capacity CBR. The capacity that actually moves is reduced by the share of devices that receive remote commands (reach), the per-domain authority cap (A_max), the lowest operating point a remote command can reach (the floor, e), and the probability that the floor actually works (ρ).
With no device-side constraint (ρ = 0, e = 1), CBR_eff = reach × CBR_raw: 35,000 MW for a national-plane compromise at reach 0.7 (Figure 2).
e is defined as a floor — the operating point that no number of repeated remote commands can push below — not as a per-command limit, because a per-command limit disappears under repetition.
This quantity is not new. NERC CIP-002 has since 2013 rated protection by "MW per cyber asset": generation of 1,500 MW or more controlled by one cyber system is Medium Impact; control centres over 3,000 MW are High Impact [I10]. The EU Network Code on Cybersecurity (NCCS) introduced ECII, an impact index in MW, with the "high impact" threshold at each country's minimum secondary reserve and "critical" at the primary reserve (3,000 MW) [S05]. CBR brings both down from large transmission assets to distribution-level DER and devices.
6. The Systemic Cyber Risk model
6.1 Severity of one compromise
- s: synchronization factor — the share of CBR_eff that moves as a step within the window. Attackers can pre-schedule, so s can approach 1 [R10]. Where a device-side ramp limit works, less moves in the window; but ramp limits live in firmware, so for a firmware-line compromise s = 1.
- FCR: primary reserve (full within seconds to 30 s); FRR: secondary reserve (minutes).
- S(x): probability that disturbance x leads to a wide-area event (load shedding or worse). Weibull form \(S(x) = 1 - \exp(-(x/x_0)^k)\), base x₀ = 1.7, k = 3.
S(x) is the probability of under-frequency load shedding or worse, not of collapse. Load shedding is the grid working as designed to avoid collapse, but to customers it is an outage of millions of households; we take it as the lower bound of "wide-area event". x = 1 is the design absorption limit; in the reference grid load shedding starts around x ≈ 2.2–3.0 (Section 7).
6.2 Annual risk for the whole fleet, all channels
The draft compared the risk of one compromise, p × S(x), between A and B. Reviewers called this "asymmetric compromise units": A's unit was the national plane, B's one of 100 domains. B has 100 attack surfaces, and both A and B share a separate channel — the vendor firmware line. We accepted this and redefined risk as the probability that at least one wide-area event occurs per year across the fleet.
- n: number of independent domains. β: inter-domain common-cause share (shared identity provider, cloud provider or CA taking several domains down together; base 5%, sensitivity 0–30%).
- p_v: annual compromise probability of firmware line v (p × p_vendor_rel, 0.3 p at base). x_v is computed from the line's reach without the per-domain cap (a line spans domains), shrunk only by the share whose floor survives (ρ_vendor), and treated as a step.
p is the annual compromise probability per control unit: base 0.01, range 0.001–0.1. It is an order-of-magnitude placement between the rate at which control-reaching vulnerabilities were published in 2024–25 (several per year) and the rate at which they were exploited with grid intent (zero). It is not a decomposition into P(vulnerability) × P(exploitation) × P(grid intent); that is a stated limitation (Section 23).
Linear metrics that do not saturate are reported alongside: expected affected capacity E[MW/yr] = Σ p × CBR_eff, and recovery exposure [MWh/yr] = Σ p × CBR_eff × T_rec.
The linear metric has an important property: splitting into n domains leaves Σ p × (C/n) × n = p × C unchanged. Splitting does not lower expected affected capacity; only the floor (e, ρ) and reach do. Splitting helps only through the convexity of S(x) — n small disturbances are less likely to cause a wide-area event than one large one.
The exponent k drives the result: k = 1 is linear, k = 4 is near zero below x = 1. We use k = 3 as base and report k = 1–4 throughout (Figure 6 right, Figure 9).
7. Calibrating grid sensitivity
We fit the x scale to literature cases. There are too few points, from grids of different size, to call this calibration in a statistical sense; it is a fit.
| Case | Simultaneous change | Reference reserve | x | Outcome |
|---|---|---|---|---|
| France 2023, two nuclear units tripped [R06] | 2,660 MW | 3,000 MW (CE FCR) | 0.89 | 49.88 Hz, no shedding |
| ENTSO-E reference incident [R08] | 3,000 MW | 3,000 MW | 1.0 | Design absorption limit |
| Dabrowski et al. (model) [R09] | 4,500 MW | 3,000 MW | 1.5 | Below 49 Hz, shedding band (paper's model result; our swing model gives 49.80 Hz and does not reproduce it) |
| East Japan, 16 March 2022 Fukushima-oki earthquake [R13] | >6,000 MW | ≈1,200 MW (3% of ≈40 GW night demand) | ≈5 | UFR operated, >2 GW shed, no collapse |
| Hokkaido 2018, initial loss [R01] | 1,160 MW | 155 MW | 7.5 | UFLS operated; further losses led to blackout |
| SolarPower Europe/DNV critical threshold [R06] | 10,000 MW | 3,000 MW | 3.3 | Cascading-collapse indicator (report threshold) |
The fitted Weibull is the black line in Figure 3, with the classification of our swing-equation model (Section 13: 45 GW demand, H = 3.5 s, FCR 3%, FRR 5%, UFLS at 48.5/48.2/47.9 Hz) as blue steps. A 1,350 MW step (x = 1) reaches 49.51 Hz; 3,000 MW (x ≈ 2.2) reaches 48.55 Hz, just above the first shedding stage; 4,000 MW (x ≈ 3.0) triggers it. S(2.2) = 0.89 and S(3.0) = 0.996, so as "probability of shedding or worse" the two agree. S(1.0) = 0.18 and S(1.5) = 0.50 assign probability to a region the swing model classes as "degraded"; we read this as S absorbing what a single-area model omits (transmission constraints, protection coordination, voltage, initial-condition spread).
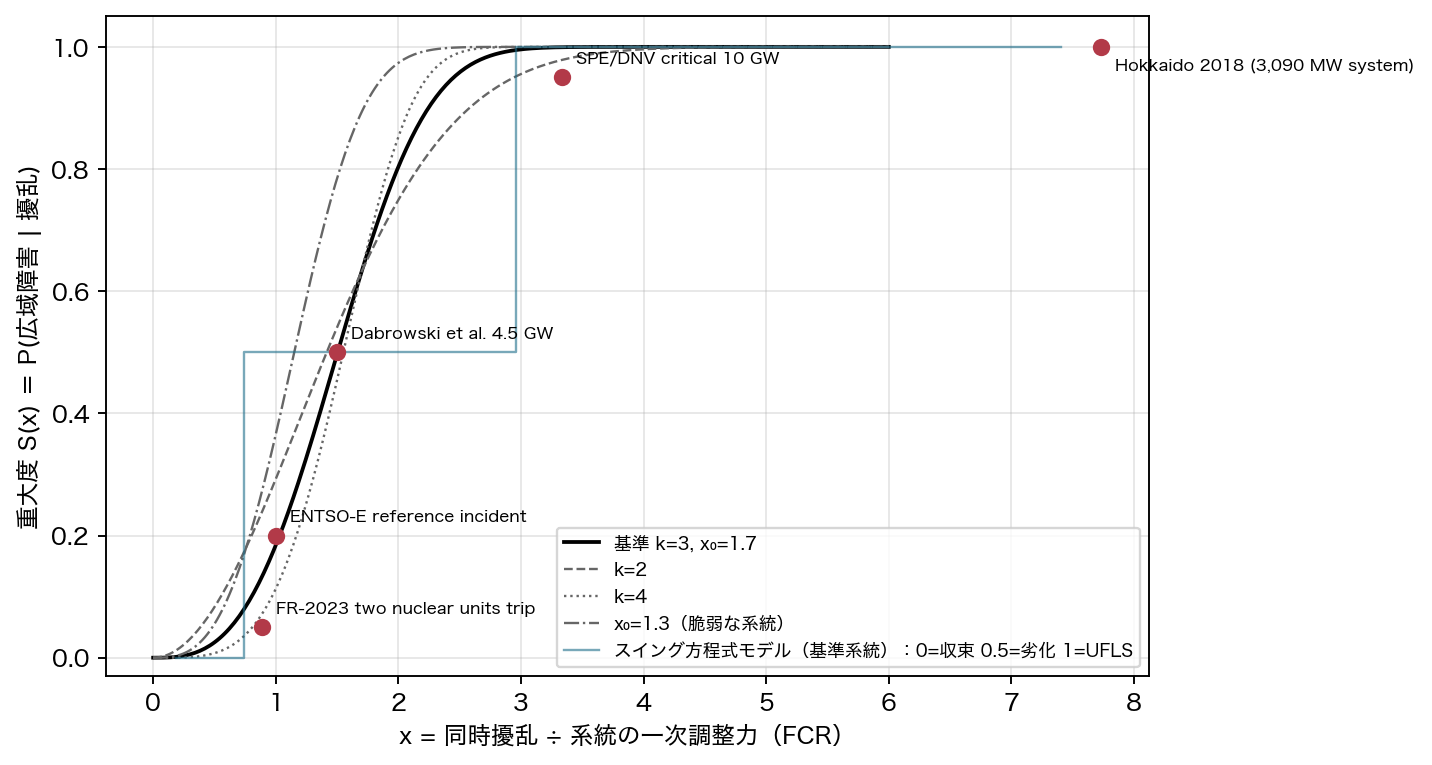
16 March 2022 and 6 September 2018 both have x above 5 and S ≈ 1. One ended in load shedding, the other in collapse. S(x) does not express the difference; additional losses (in Hokkaido, hydro tripped by a line fault) and grid size did. We group both as "shedding or worse".
Limitations first. The model is single-area, frequency only. Transmission congestion, voltage collapse and protection cascades are absent; the Iberian blackout of April 2025 was voltage-driven [R04] and the 2006 European split flow-driven [R03]. And x = ΔP/FCR is not transferable between grids with different inertia or FCR-to-demand ratios: Continental Europe's FCR is about 0.75% of demand, the reference grid's 3%. Carrying an x₀ fitted on European points to a Japanese grid is a stretch; we carry the error in the range of k and leave per-grid calibration as an open problem (research/open_problems.md).
8. Two models, both defined realistically
To be fair we give both sides a "realistic best". The draft's A was "one credential moves everything, pre-2020 design"; reviewers called it a straw man. We define A in two stages.
Model A: centralized control + strong authentication + certification. All DER connect to one DERMS/cloud control plane. Devices are mutually authenticated, encrypted and certified; compromise probability is one-third of uncertified (sensitivity to one-tenth). Commands are executed without device-side validation. The plane is redundant, but credentials, API and keys are logically one.
Model A+: A + server-side aggregate cap. The tools of a real DERMS — tenant isolation, scoped API keys, rate limits, multi-party approval for fleet-wide commands, staged rollout (1% → 10% → 100%), command quotas on HSM-held keys, an independent safety monitor that blocks deviation from the TSO schedule — expressed as "the total capacity that can be moved in one window". Base 1,500 MW per window (the CIP-002 Medium threshold). The cap binds under an API-credential compromise; it does not under a full-backend compromise (including the safety monitor), to which we assign 0.3 p (0.1–1).
Model B: distributed autonomy, upper link advisory. DER belong to 100 independent control domains (independent credentials, keys, tenants; firmware distribution still shared per vendor). Each device observes voltage, frequency, RoCoF and SOC locally and has a constraint engine that accepts, modifies or rejects upper-level commands. The lowest operating point a remote command can reach is 30% of rating (floor e = 0.3), rate of change 20% of rating per minute, remote authority per domain capped at 500 MW. The floor actually works with probability ρ = 0.95 (firmware defects, misconfiguration, maintenance bypass leak 5%). On loss of the upper link devices run on the last valid schedule — a function Japan's curtailment-capable inverters already have in design A [S12], so not a B-specific difference. B's only specific difference is enforcing the floor and the authority cap on the device.
e = 0.3, 20%/min and 500 MW are design variables without numerical basis. Germany's §14a EnWG guarantees controllable loads at least 4.2 kW (40% above 11 kW) when the grid operator dims them, forbids full disconnection, and limits it to two hours [S06] — a legislated floor, equivalent to e ≈ 0.4 for an 11 kW wallbox, enforced in the smart-meter gateway software, not in an independent circuit.
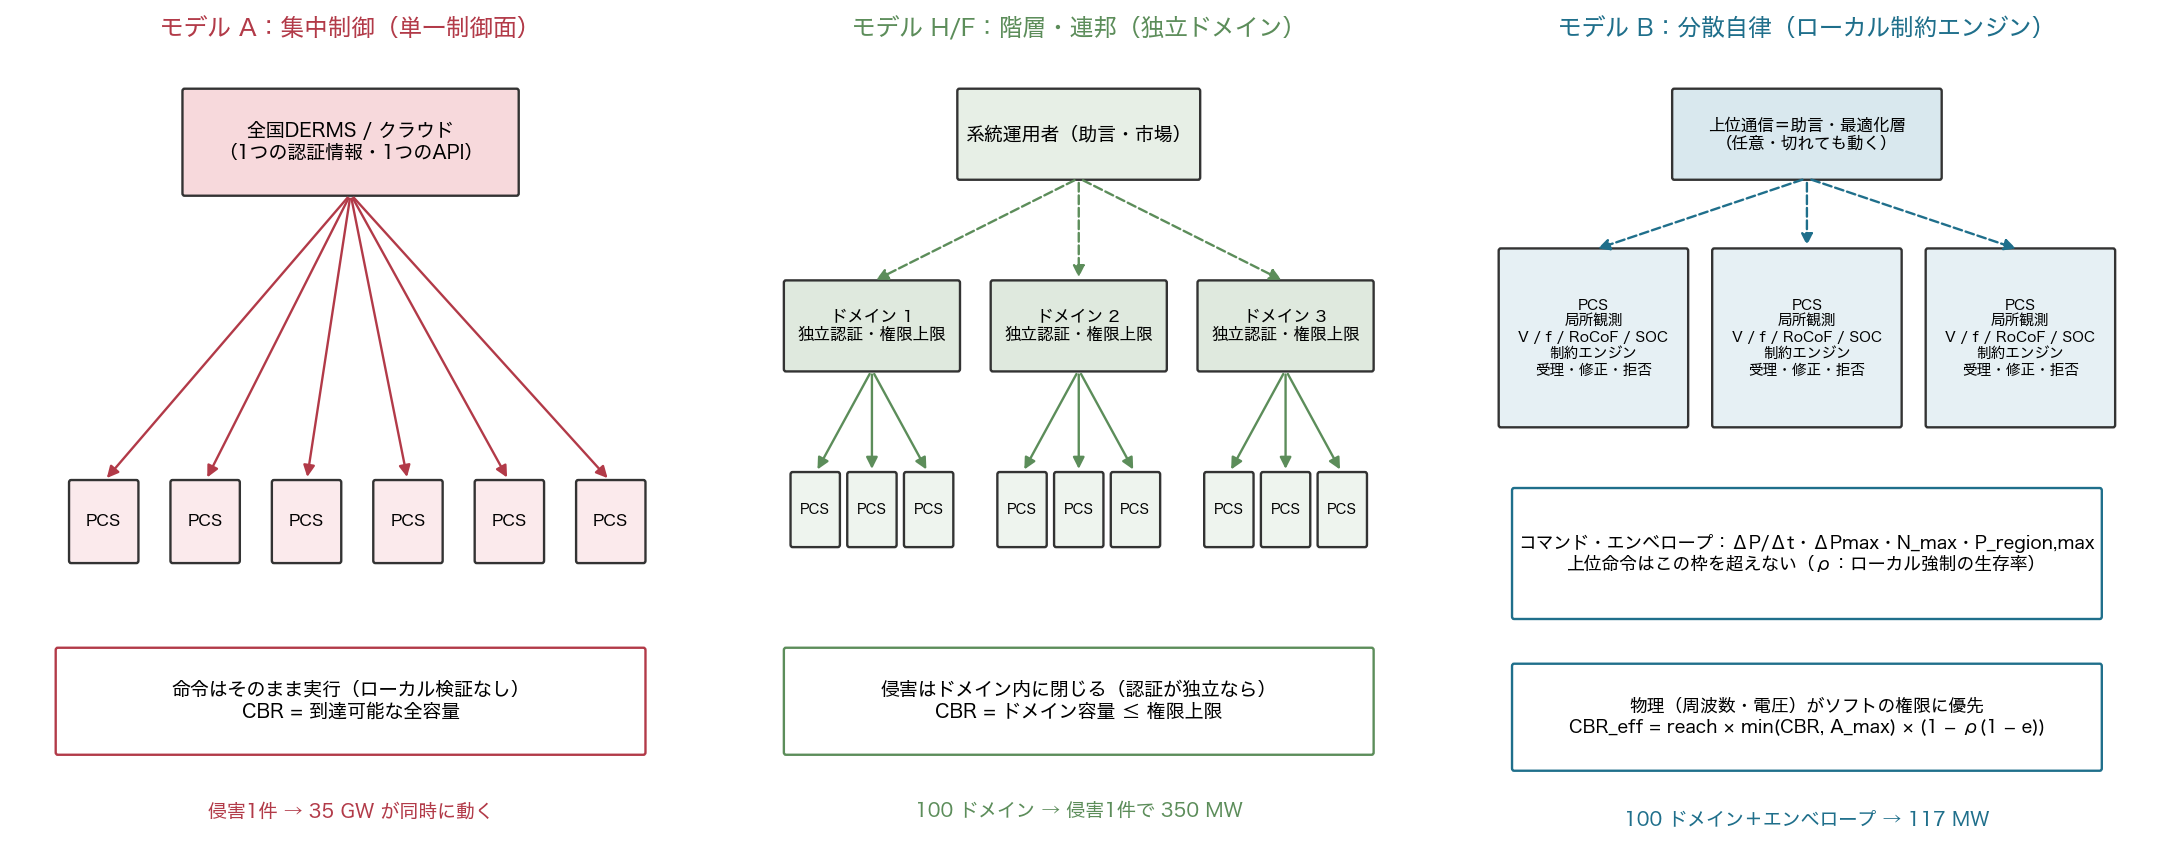
Intermediate forms are evaluated too: H hierarchical (10 regional domains, no device constraints), F federated (100 domains, none), C cellular (10,000 cells, none — no operational reality, a theoretical floor), B4 single plane + device constraints only, B1 100 domains + floor, no cap, and B variants B5 floor held by independent monitor, B6/B7 B5 + firmware-line reach cap 12%/5%.
9. The Local Autonomy Principle and Bounded Authority
9.1 The compromised command problem
A command arrives by the legitimate path, with a legitimate signature and legitimate authority — and it is the attacker's. Zero Trust (NIST SP 800-207 [S11]) verifies everything, but a command that passes verification is executed. In Solarman/Deye the attacker's commands were legitimate API calls [I01].
Authentication is not useless here, but it is not sufficient. What is needed is a limit on what a device will execute even for a legitimate command.
9.2 The Local Autonomy Principle
Principle. A DER must be able to decide on its own, from locally observable quantities (voltage, frequency, RoCoF, SOC, temperature), an operating point that does not harm the grid, regardless of whether the upper link is present or correct. Upper-level commands are accepted within that local judgement.
This is not distrust of the upper level, whose commands are essential for balancing, markets and congestion. The principle separates survival control from economic control: the former closes locally, the latter is the upper level's job. Grid-forming inverters hold frequency without communication [W04]; microgrid islanding is a precedent for surviving a lost link [S03].
9.3 Bounded Authority and the Command Envelope
| Constraint | Symbol | Meaning | Precedent |
|---|---|---|---|
| Output floor | e | Lowest operating point reachable by remote command (fraction of rating); cannot be undercut by repetition | §14a's 4.2 kW floor |
| Rate of change | ΔP/Δt | Upper limit on speed of change | Curtailment ramp requirements |
| Simultaneous units | N_max | Units one credential may command at once | — |
| Regional total | P_region,max | Total one domain may move within an area | NCCS ECII, CIP-002 1,500 MW |
| Local conditions | f, V, RoCoF | e.g. reject a curtailment command while frequency is low | IEEE 1547 ride-through |
A command is accepted (within the envelope), modified (clipped to it) or rejected (contradicts local observation, or repeatedly outside). Rejections are reported upward.
9.4 What "hardware enforcement" means
The draft placed the last stage "outside software authority, as relays or hardware limits". Inverter designers objected, correctly: the DSP firmware sets the current reference, and slew-rate limits and floor clamps are themselves firmware. Interconnection protection relays can only trip, and a trip is a 100% step — the opposite of a floor. No component "keeps 70% flowing in hardware".
We decompose the term into three:
- Physical disabling of the remote-OFF and remote-OTA command classes. A communications module with no write path, a jumper, a DIP switch. Feasible in hardware. The attacker can no longer send "stop" but can still send "reduce".
- An output floor held by an independent monitor circuit. A monitor MCU separate from the main MCU watches output with independent current measurement and overrides the main MCU below the floor. This is a second firmware, meaningful only if its update path and signing key are separated from the main firmware. Make it non-updatable and it cannot be fixed; make it updatable and it returns to a common cause. We cannot resolve this dilemma here (open problem). For PV the floor is 30% of available output, not of rating — on a 40%-irradiance day the attacker gets 10%. For batteries and EVs it is a floor on the charge/discharge point.
- Rate-of-change limit. Clouds change PV output by 50% in seconds; a monitor circuit cannot know a command's origin; fault-ride-through requires fast recovery. The ramp limit therefore stays in the main firmware and is lost under firmware compromise.
The model represents (1)+(2) as vendor_hw_enforce (share whose floor survives) and treats (3) as s = 1 under firmware compromise. This decomposition is what moved scenario B5b in Section 13 from "contained" in the draft to "load shedding".
10. Failure domains and the Blast Radius Cap
Splitting 10 million devices into 10,000 failure domains gives 1,000 devices, 5 MW per domain — the intuition behind "distribution is safety". The model's result is more involved. All values below are whole-fleet, per year, all channels (architecture_comparison.csv, Figure 4).
| Configuration | CBR_eff per compromise (plane) | x | CBR_eff of largest firmware line | P(some compromise)/yr | Risk: plane channel | Risk: vendor channel | Total |
|---|---|---|---|---|---|---|---|
| A0 single plane, uncertified | 35,000 MW | 25.9 | 10,500 MW | 1.0% | 1.0×10⁻² | 1.8×10⁻² | 2.8×10⁻² |
| A single plane + certification (p/3) | 35,000 MW | 25.9 | 10,500 MW | 0.3% | 3.3×10⁻³ | 6.1×10⁻³ | 9.4×10⁻³ |
| A+ A + server-side cap 1,500 MW | 1,050 MW | 0.78 | 10,500 MW | 0.1% (backend) | 1.3×10⁻³ | 1.8×10⁻³ | 3.1×10⁻³ |
| H 10 domains, no device constraints | 3,500 MW | 2.59 | 10,500 MW | 9.6% | 8.9×10⁻² | 1.8×10⁻² | 1.1×10⁻¹ |
| F 100 domains, none | 350 MW | 0.26 | 10,500 MW | 63% | 3.9×10⁻³ | 1.8×10⁻² | 2.2×10⁻² |
| C 10,000 domains, none | 3.5 MW | 0.003 | 10,500 MW | 100% | 5.0×10⁻⁴ | 1.8×10⁻² | 1.9×10⁻² |
| B4 single plane + floor (software) | 11,725 MW | 3.26 | 10,500 MW | 1.0% | 1.0×10⁻² | 1.8×10⁻² | 2.8×10⁻² |
| B 100 domains + floor + cap (software) | 117 MW | 0.03 | 10,500 MW | 63% | 5.1×10⁻⁴ | 1.8×10⁻² | 1.9×10⁻² |
| B3 B + certification (p/3) | 117 MW | 0.03 | 10,500 MW | 28% | 1.7×10⁻⁴ | 6.1×10⁻³ | 6.3×10⁻³ |
| B5 B + floor held by independent monitor | 117 MW | 0.03 | 3,518 MW | 63% | 5.1×10⁻⁴ | 6.8×10⁻³ | 7.3×10⁻³ |
| B6 B5 + firmware-line reach cap 12% | 117 MW | 0.03 | 1,407 MW | 63% | 5.1×10⁻⁴ | 3.5×10⁻³ | 4.0×10⁻³ |
| B7 B5 + firmware-line reach cap 5% | 117 MW | 0.03 | 586 MW | 63% | 5.1×10⁻⁴ | 7.5×10⁻⁴ | 1.3×10⁻³ |
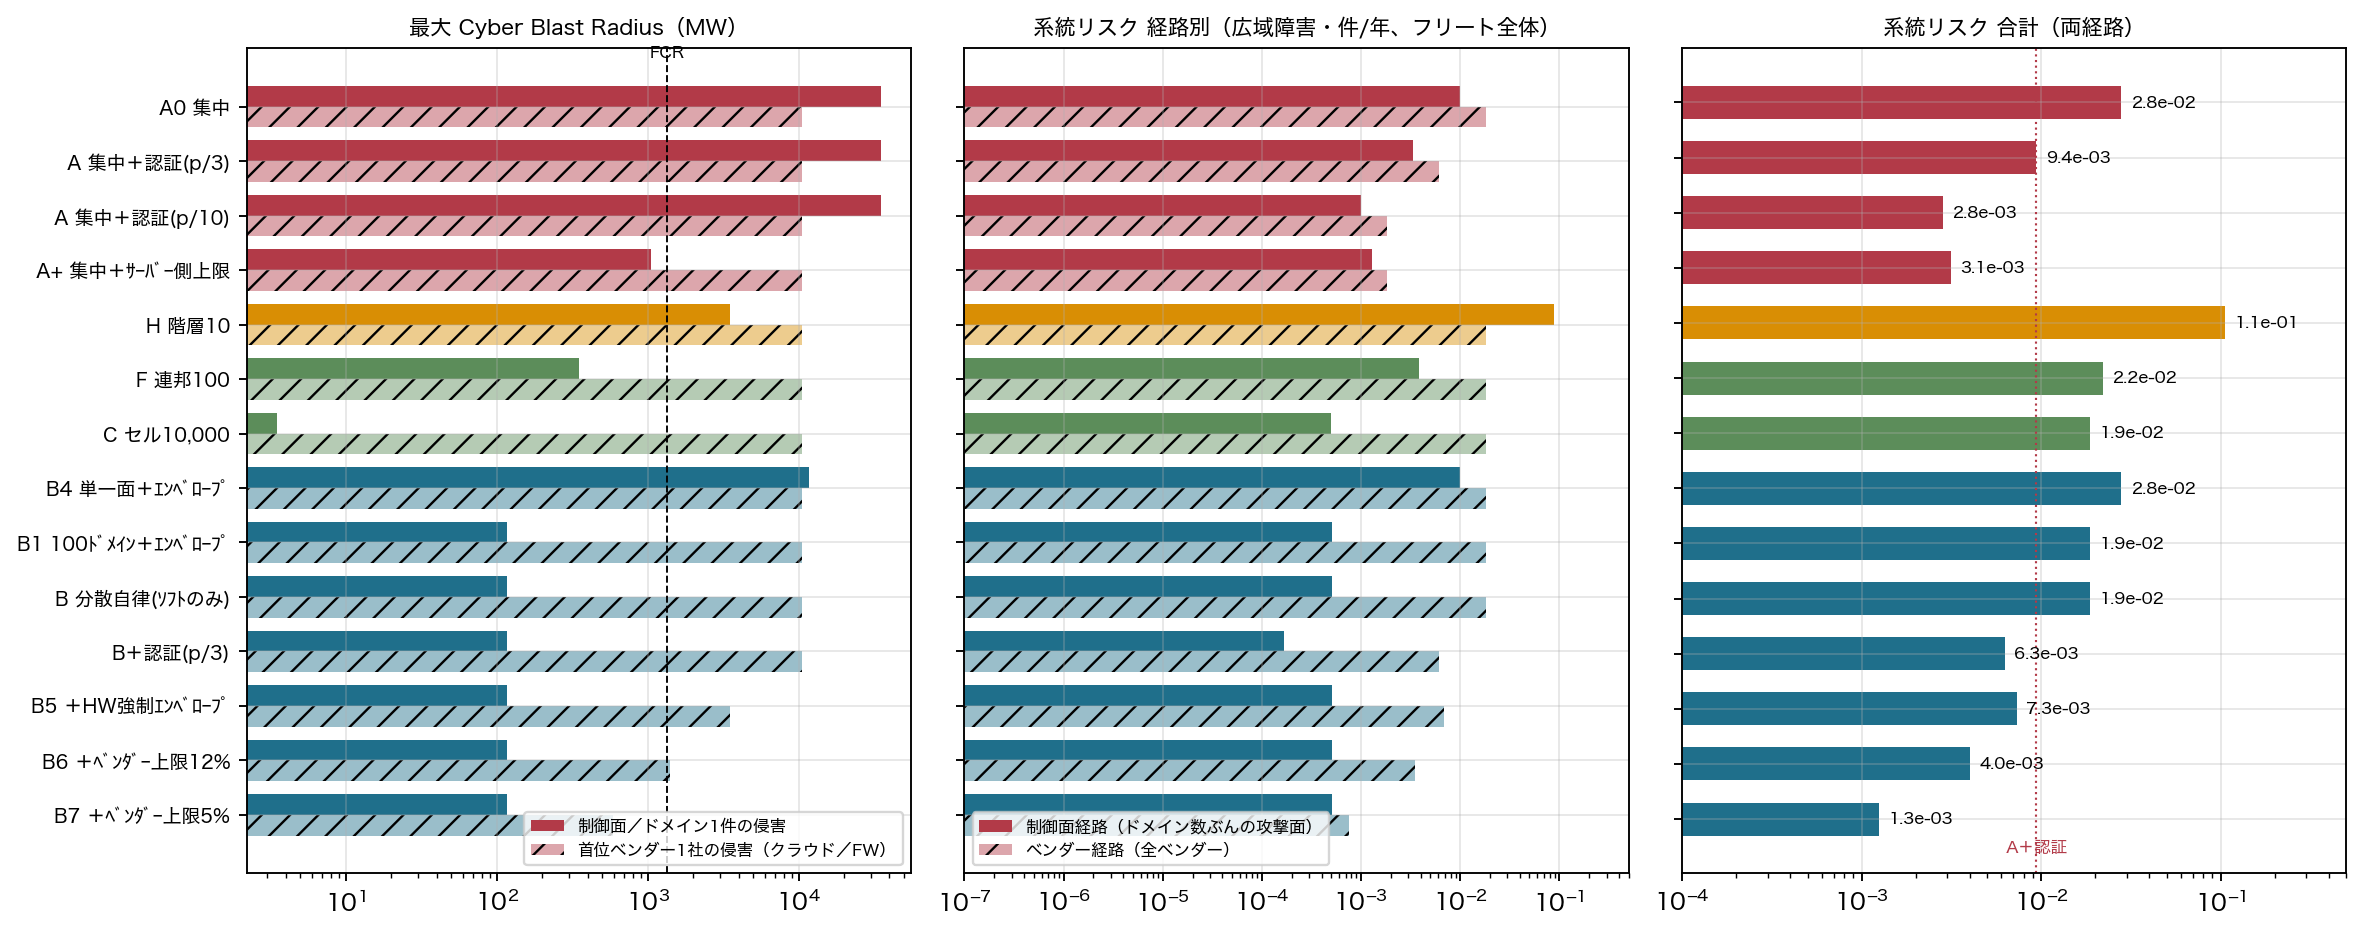
Five things can be read.
- On the plane channel alone, splitting and the floor work. F and C keep one compromise within reserves; B stops at 117 MW. Ten domains (H) are not enough. And splitting multiplies the attack surface — in B some domain is compromised in 63% of years. Even so B's plane-channel risk is about one-seventh of certified A: many small disturbances are less likely to cause a wide-area event than one large one.
- The floor alone is not enough. A single plane with device floors (B4) still moves 11.7 GW at ρ = 0.95, e = 0.3; Figure 10 (left) shows x stays above 1.5 even at ρ = 0.99.
- The authority cap is meaningless without independent credentials. If one credential yields all 100 domains, the cap "exists" per domain but the total is B4's 11.7 GW (Section 13, B3). The inter-domain β represents the middle ground.
- The total is dominated by the vendor channel. A compromise of the largest firmware line (15 GW installed, 10.5 GW reachable) crosses domain caps and erases the floor and ramp limit implemented in firmware. Shared by A and B, it leaves software-only B's total (1.9×10⁻²) equal to A0 and worse than certified A; B3 with certification is about equal to A. Changing the architecture does not change the vendor channel.
- What lowers the total is the independent-monitor floor and the firmware-line reach cap. B5 7.3×10⁻³, B6 4.0×10⁻³, B7 1.3×10⁻³. The centralized side reaches the same order with a server-side cap (A+ 3.1×10⁻³).
The design requirement is therefore not "number of domains" but a cap on the capacity reachable from one credential, one key, one distribution path — the Blast Radius Cap, proposed as the policy KPIs "Maximum Remote Authority" and "remote reach per firmware line" (Section 19).
11. The centralization paradox and the break-even
The benefits of central control are real: monitoring in one place, fast anomaly detection, one fix delivered everywhere, maximum balancing value. So centralization proceeds.
The paradox is that the efficiency centralization brings and the Blast Radius it brings are the same thing. Moving everything from one place is efficient, and moving everything from one place is dangerous. Only the ceiling — how much can be moved — can be separated. A+ is exactly that ceiling on the centralized side, giving up part of the efficiency (moving more than 1,500 MW at once) for a smaller Blast Radius.
The break-even, comparing single compromises: centralization lowers compromise probability to 1/p_f while multiplying Blast Radius by Y. With the distributed Blast Radius at 10 MW (x = 0.007):
| Probability reduction 1/p_f | Blast Radius multiplier Y | Centralized CBR | Risk ratio A/B (k = 3) | Range (k = 1–4) | Linear ratio A/B |
|---|---|---|---|---|---|
| 1/10 | ×10 | 100 MW | 10² | 10⁰–10³ | 1 |
| 1/10 | ×100 | 1,000 MW | 10⁵ | 10¹–10⁷ | 10 |
| 1/3 | ×1000 | 10,000 MW | 10⁶ | 10²–10⁸ | 333 |
Ratios depend on k by orders of magnitude and are given as ranges. Even on the linear metric, a tenfold probability cut with a hundredfold Blast Radius leaves the centralized side ten times worse.
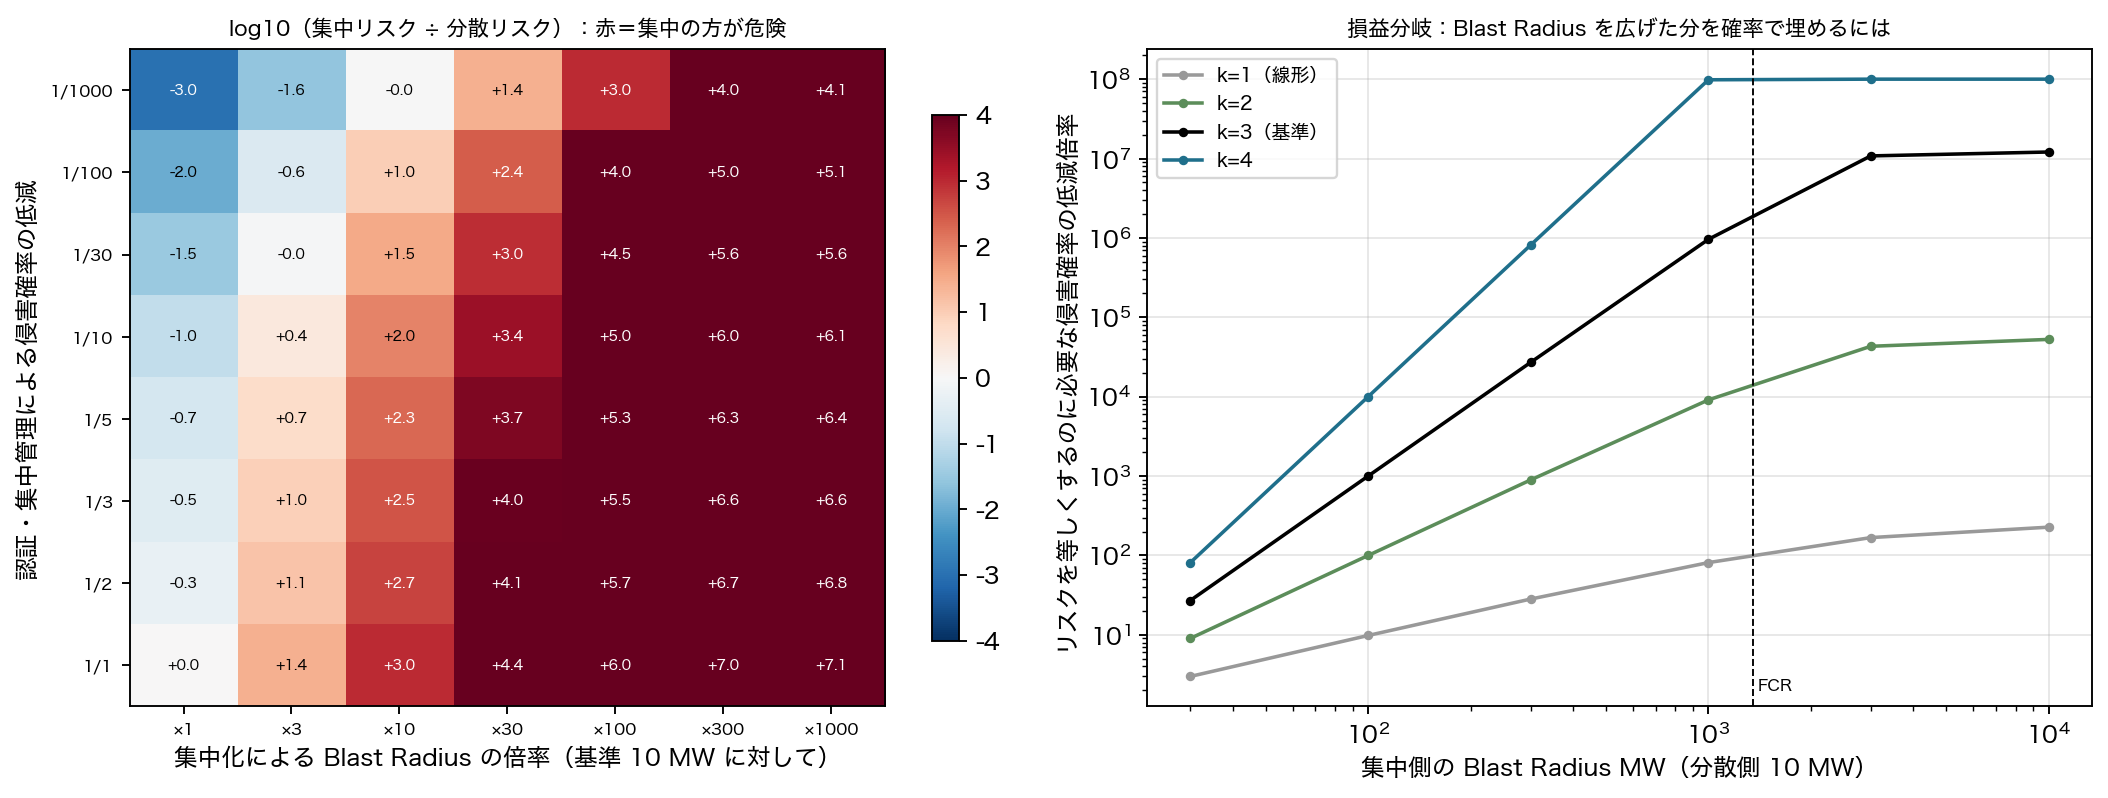
Figure 6 (right) shows, for k = 1–4, the probability reduction needed to make a centralized Blast Radius equal in risk to a distributed one. Even at k = 1, making 10,000 MW equivalent to 10 MW needs a 227-fold reduction. Certification is expected to deliver a few-fold.
Above the reserve, severity saturates: with 35 GW movable, cutting probability to a third or a tenth leaves the outcome "collapse". Lowering probability there lowers risk only proportionally.
As an extreme example, compare A: p = 0.1%, 5 GW with B: p = 1%, 10 MW (illustrative; changeable in the simulator). A has x = 3.7, severity ≈ 1, systemic risk 1.0×10⁻³/yr. B has x = 0.007 and severity 8×10⁻⁸ at k = 3, 4×10⁻³ at k = 1. The risk ratio lies between 10¹ and 10⁸ for k = 1–4, and A is 50× larger on the linear metric. Even with a tenfold higher compromise probability, a 500-fold smaller Blast Radius gives lower risk for any k. This is a single-compromise comparison; counting attack surfaces fleet-wide, as in Section 10, narrows it.
12. Correlated failure, common cause, monoculture
"The probability that 10 million devices are compromised together is p¹⁰⁰⁰⁰⁰⁰⁰, so negligible" holds only for independent failures. Devices sharing a cloud, a firmware line, a certificate or an aggregator are not independent.
The standard treatment is the β-factor method [S04]: a share β of each device's failures occur as common cause. IEC 61508 puts β at 0.5–10%. ccf_analytic.csv shows that with β = 0 the probability of 10% failing together is effectively zero; at β = 1% it is 10⁻⁶, at 10% 10⁻⁵. The mean failure rate is unchanged; the tail is.
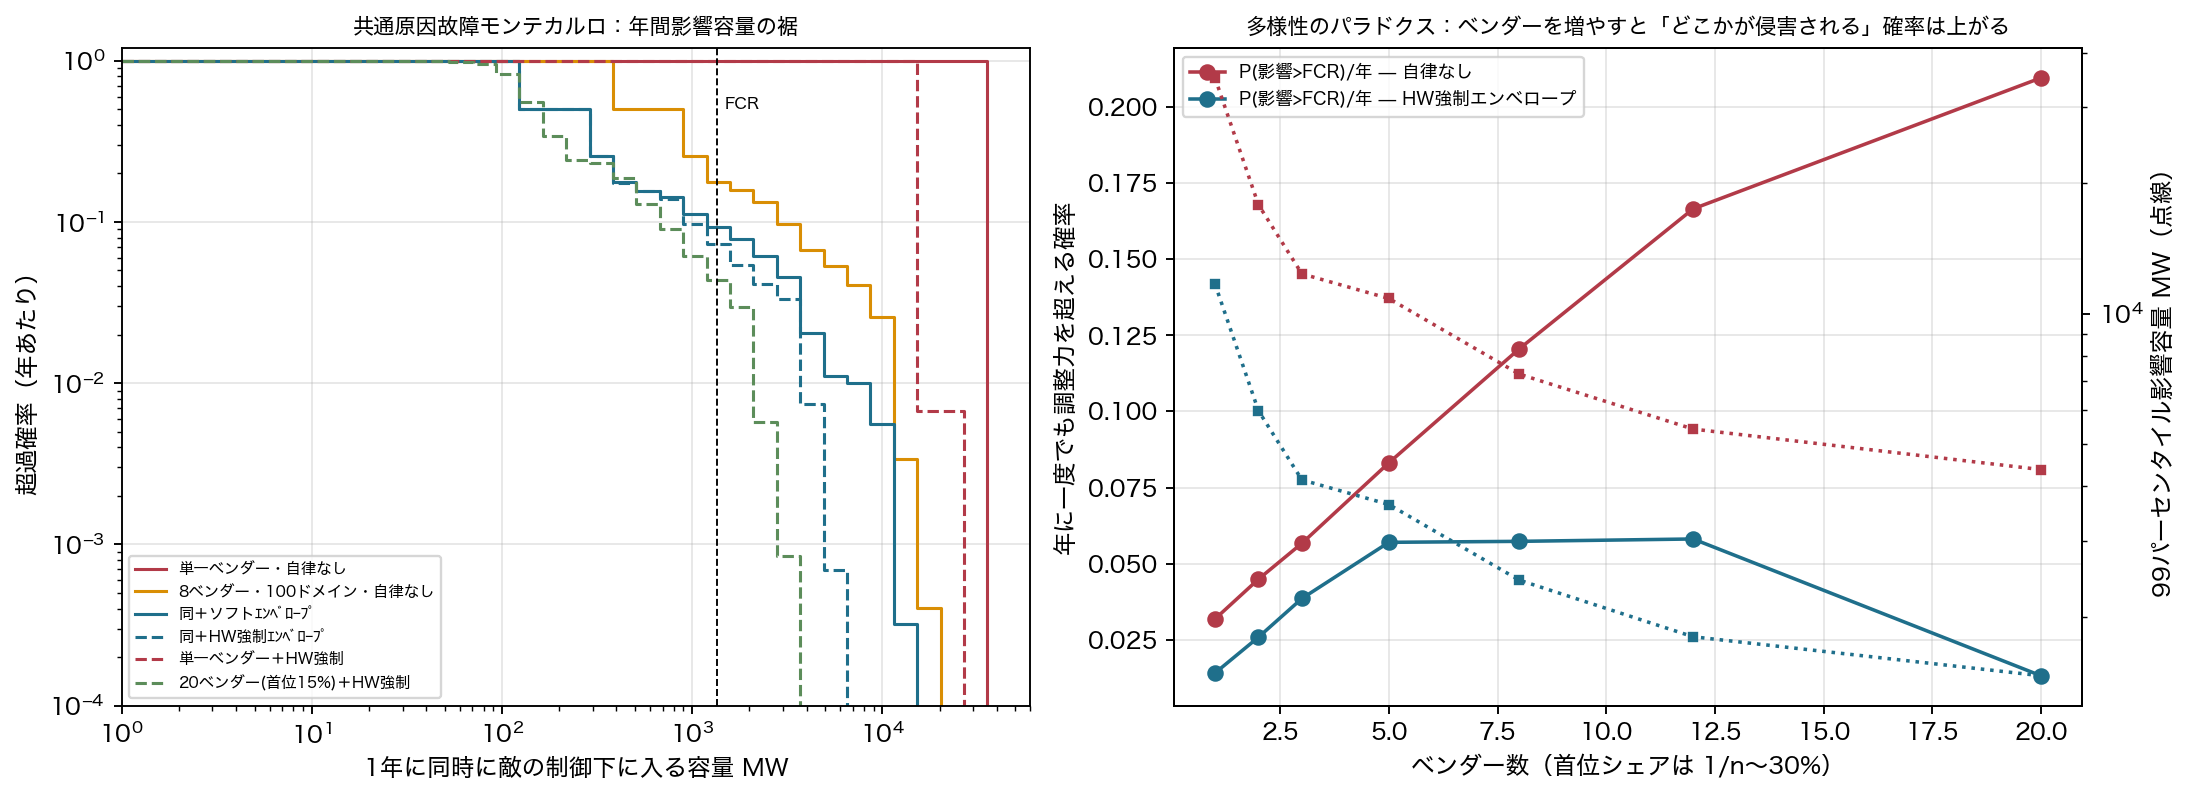
Figure 7 (left) is a 200,000-year Monte Carlo with vendor cloud, firmware line and aggregator credentials as common causes. A single vendor (red) is rarely compromised but its tail reaches 35 GW. Eight vendors and 100 domains (orange) raise the frequency and stop the tail at 10.5 GW (largest vendor). Holding the floor in an independent monitor (blue dashed) brings it to 3.5 GW.
Figure 7 (right) is the "diversity paradox": the annual probability of exceeding FCR at least once is 0.023 for one vendor and 0.044 for eight vendors with independent monitors — higher when split, because there are more independent places to breach. But the 99th-percentile affected capacity falls from 35 GW to 3.5 GW. Diversity reduces the size of an event, not its frequency. It is insufficient alone; combined with per-firmware-line reach caps and floors it stays within reserves (20 vendors, 15% top share, independent monitors: p99 1.9 GW, 1.5×FCR exceeded 0.0065/yr).
The true common cause is OTA. B's "100 independent domains" concerns credentials and keys; firmware distribution remains with eight vendors. In Japan the same inverter platform is sold under several brands (OEM supply), so firmware-line share exceeds brand share. CrowdStrike 2024 made a trusted update channel the common cause for 8.5 million machines [I07]; South Australia 2016 saw the fault-ride-through settings of nine wind farms become the common cause of a state-wide blackout [R05]. "Configuration monoculture" has already caused wide-area failures in power.
12.1 Galápagos syndrome and monoculture
There is a Japan-specific path. If Japan-specific certification or communication requirements narrow the field of vendors, the largest firmware line's share rises; from 30% to 60% doubles CBR_vendor from 15 to 30 GW. A certification scheme that unintentionally strengthens monoculture and widens Blast Radius exists in the equations. Whether JC-STAR does so is an empirical question for future market data; we only note the possibility (research/jc_star_and_japan_context.md). Geer et al. called software monoculture a systemic risk in 2003 [W07].
13. Attack simulation: one attack, two endings
We apply the same attack to a single-area swing-equation model (model/grid_sim.py). Grid: 45 GW demand, H = 3.5 s, FCR 1,350 MW (3%, τ = 10 s), FRR 2,250 MW (5%, τ = 90 s), load damping 1.5, UFLS at 48.5/48.2/47.9 Hz at 10% each, generator tripping at 47.5 Hz. Attack: a compromise of the control cloud or a firmware line cuts reachable DER output simultaneously. Devices without a working floor (1 − ρ) and devices whose ramp limit died with the firmware move as a step; the rest at 20%/min. x follows Section 6 (step part against FCR, total against FCR + FRR, larger of the two).
| Scenario | Output lost | of which step | x | Max RoCoF | Nadir | Outcome |
|---|---|---|---|---|---|---|
| A1 national plane, 50% cut | 17,500 MW | 17,500 | 13.0 | 2.78 Hz/s | 47.59 Hz | Load shedding |
| A2 national plane, full OFF | 35,000 MW | 35,000 | 25.9 | 5.56 Hz/s | 47.44 Hz | Collapse |
| A3 largest vendor cloud, full OFF | 10,500 MW | 10,500 | 7.8 | 1.67 Hz/s | 48.20 Hz | Load shedding |
| A4 A+ server-side cap 1,500 MW, API credential compromise | 1,500 MW | 1,500 | 1.1 | 0.24 Hz/s | 49.43 Hz | Degraded (reserves exhausted) |
| H1 one of 10 domains, full OFF | 3,500 MW | 3,500 | 2.6 | 0.58 Hz/s | 48.50 Hz | Load shedding |
| F1 one of 100 domains, full OFF | 350 MW | 350 | 0.26 | 0.06 Hz/s | 49.92 Hz | Contained |
| B1 one of 100 domains, device constraints on | 117 MW | 18 | 0.05 | ≈0 | 50.00 Hz | Contained |
| B2 national plane, floor on, no cap | 11,725 MW | 1,750 | 5.0 | 0.69 Hz/s | 48.20 Hz | Load shedding |
| B3 cap per domain, one credential opens all | 11,725 MW | 1,750 | 5.0 | 0.69 Hz/s | 48.20 Hz | Load shedding |
| B4 10 of 100 domains at once (shared IdP) | 1,173 MW | 175 | 0.50 | 0.03 Hz/s | 49.96 Hz | Contained |
| B5a largest firmware line, software-only floor | 10,500 MW | 10,500 | 7.8 | 1.67 Hz/s | 48.20 Hz | Load shedding |
| B5b same, floor survives in independent monitor, ramp lost | 3,518 MW | 3,518 | 2.6 | 0.58 Hz/s | 48.50 Hz | Load shedding |
| B5b′ hypothetical: floor and ramp both survive | 3,518 MW | 525 | 1.5 | 0.08 Hz/s | 49.86 Hz | Contained (reference) |
| B5c firmware-line reach capped at 12%, floor survives | 1,407 MW | 1,407 | 1.04 | 0.22 Hz/s | 49.48 Hz | Degraded |
| B5d firmware-line reach capped at 4%, software-only | 1,400 MW | 1,400 | 1.04 | 0.22 Hz/s | 49.48 Hz | Degraded |
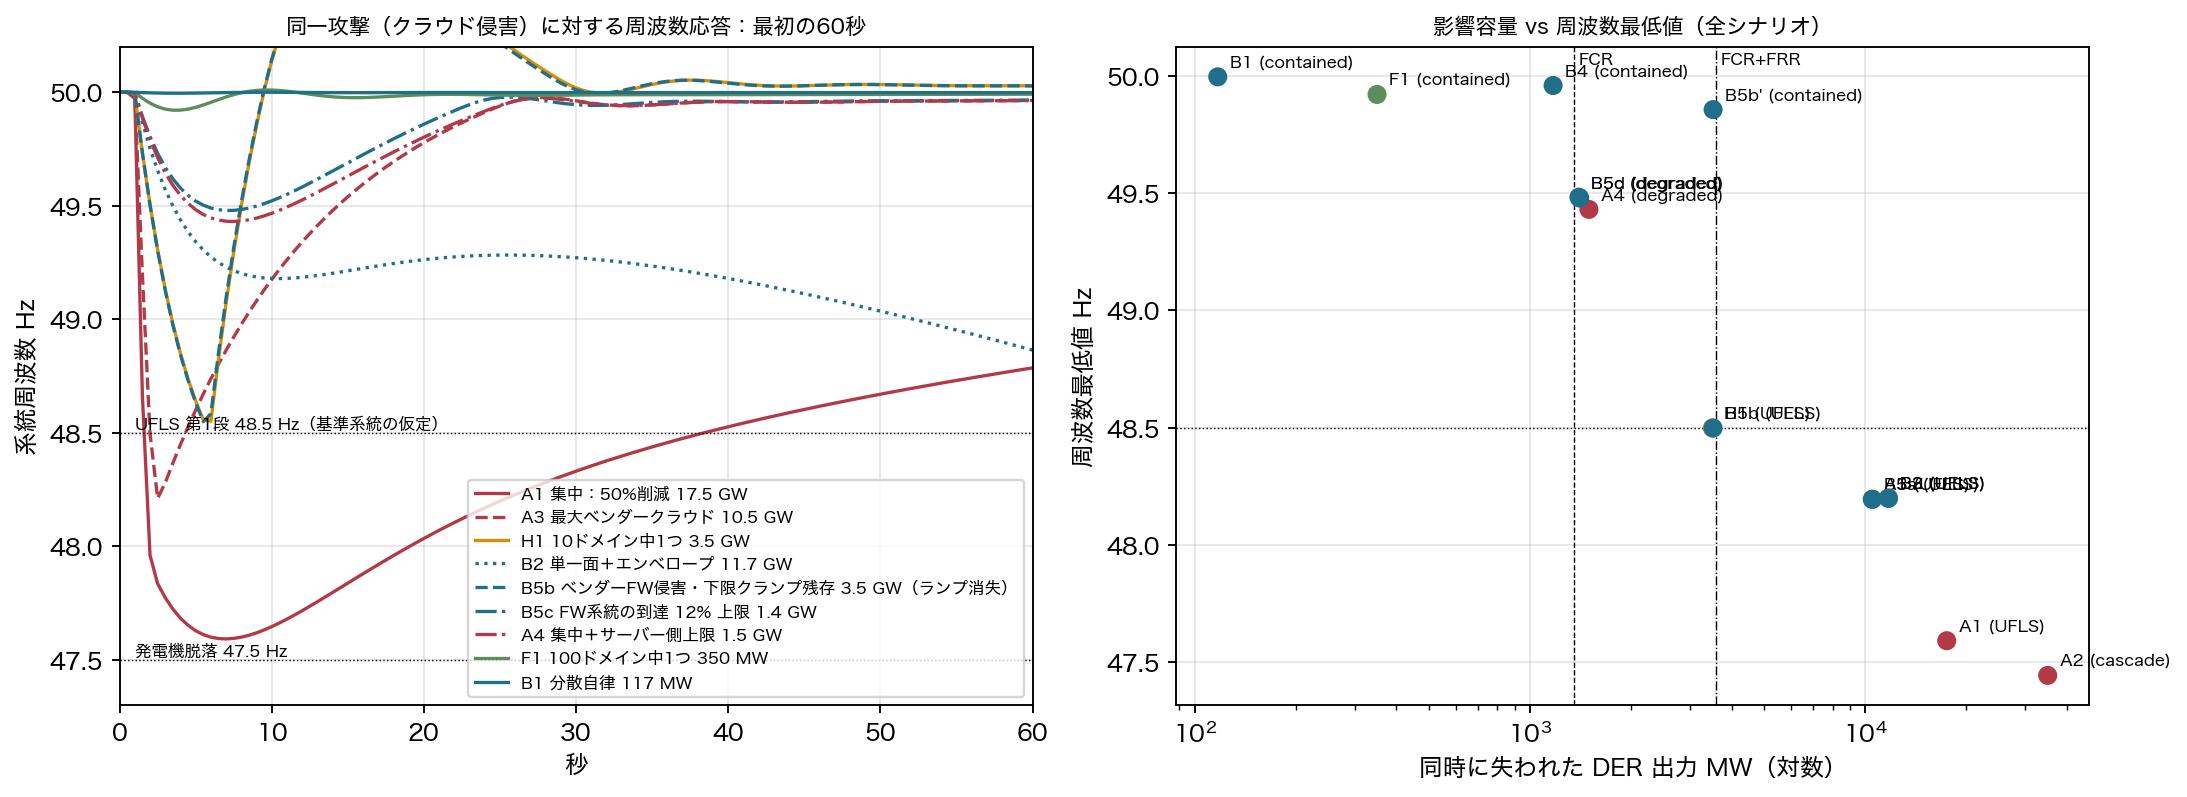
A1 hits 47.6 Hz within two seconds even at a 50% cut, with load shedding just before generator tripping. A3 — one vendor's cloud — also ends in shedding, the structure SUN:DOWN described as "more than a dozen manufacturers above 3 GW each in Europe" [R06].
In B1 the same plane attack stops at 117 MW and frequency barely moves. The difference is not that the compromise did not happen; it does, with the same probability. The difference is the reach of one credential (1/100) and how far a remote command can reduce output (to 70%).
B2, B3 and B5a are where distributed autonomy loses: an unsplit plane, non-independent credentials, a software-only floor. Missing any of the three, B ends like A3.
B5b was "contained" in the draft. As reviewers noted, the ramp limit dies with the firmware; even with the floor, 3,518 MW drops as a step and shedding follows. B5b′ is the reference value if a ramp limit survived in hardware, which current inverters cannot provide. Beyond this point only the reach of one firmware line can lower the outcome: to avoid shedding (x < 1) in the reference grid, about 1,350 MW (11.5% of the fleet) if the floor survives, 3.9% if software-only (Figure 10 right, vendor_share_limit.csv). A hypothetical design keeping both floor and ramp would allow 30.7%, but it does not exist today.
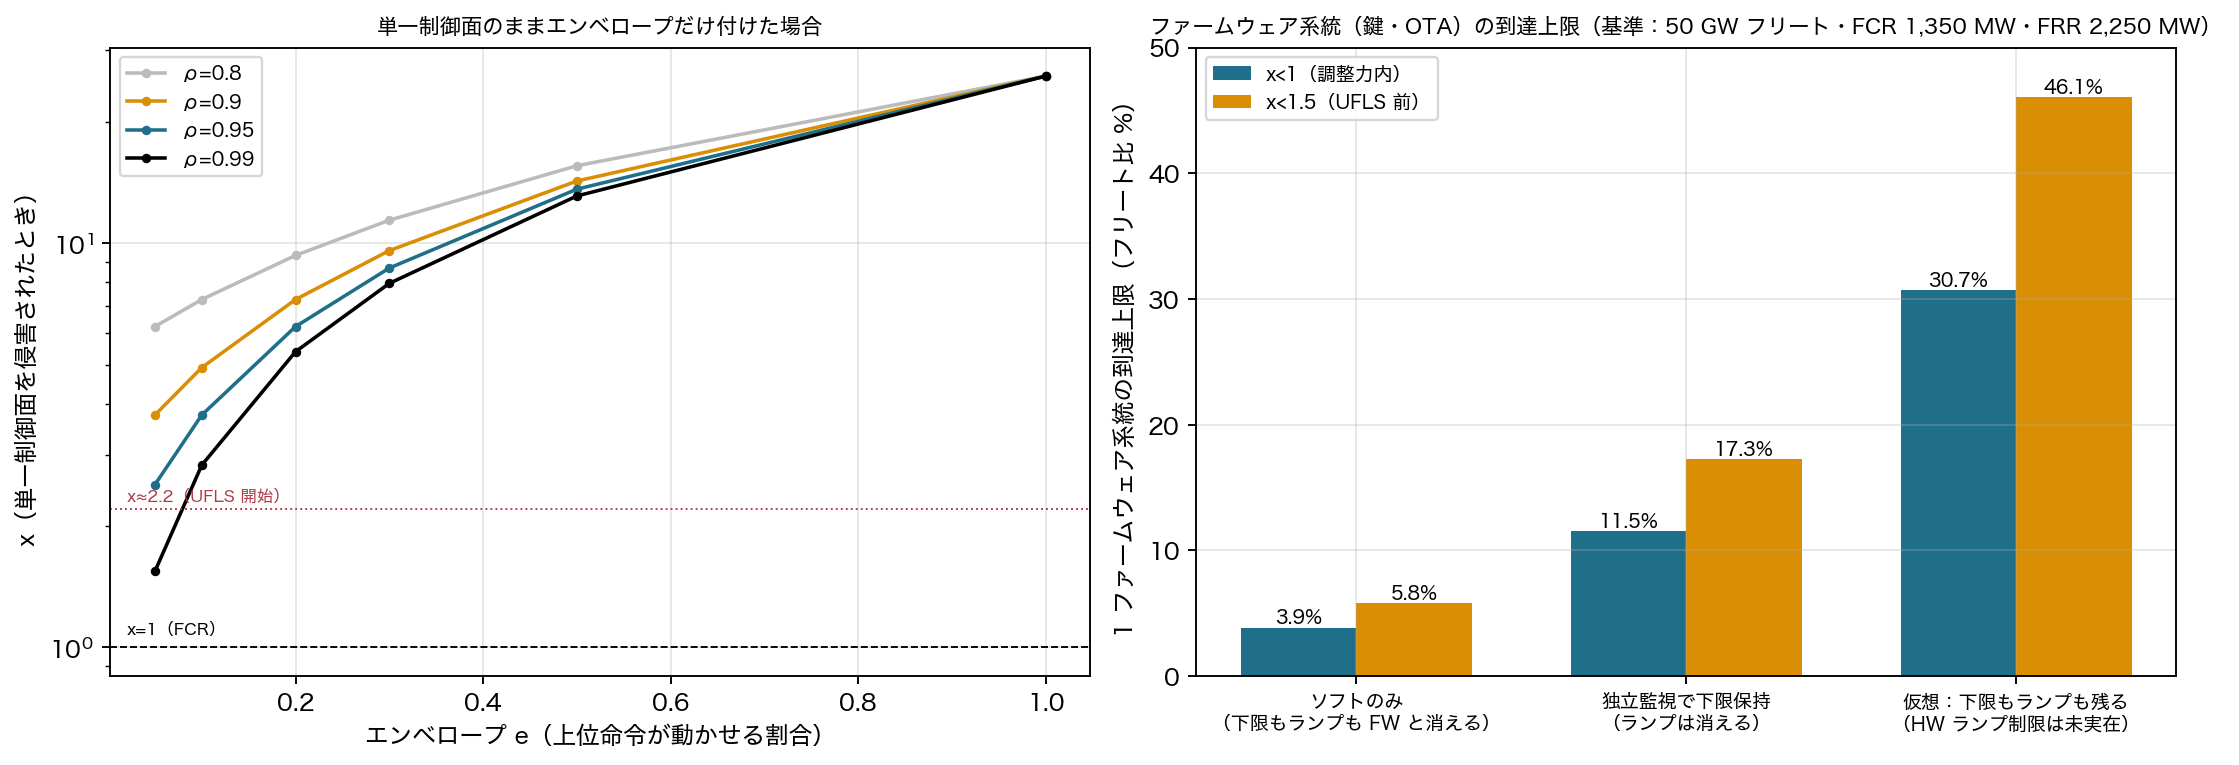
A4 is the centralized answer. An independent server-side safety monitor with an aggregate cap stops an API-credential compromise at 1,500 MW — the same "degraded" band as B5c. What remains is a full-backend compromise.
14. Monte Carlo: what survives when assumptions move
We sampled the uncertain variables of the assumptions table — unit count, capacity, reach, vendor count and shares, compromise probability, certification factor, relative probabilities of vendor-channel and backend compromise, inter-domain β, server-side cap, demand, reserves, severity shape — from LOW–HIGH triangular distributions (20,000 draws). B's design variables (100 domains, 500 MW, e = 0.3, 20%/min) are fixed as a design; the certification factor applies to all configurations. Four configurations: A, A+, B (software-only), Bfull (B + independent-monitor floor + 12% firmware-line reach cap).
| Comparison | Distributed side lower | Lower by 10× | Median ratio |
|---|---|---|---|
| Plane channel only: B vs A | 100% | 65% | 14 |
| Total: B (software) vs A | 100% | 5% | 1.8 |
| Total: Bfull vs A | 99% | 46% | 9 |
| Total: A+ vs A | 99% | 0% | 2.7 |
| Total: Bfull vs A+ | 83% | 24% | 3.3 |
| Total: B (software) vs A+ | 33% | 2% | 0.7 |
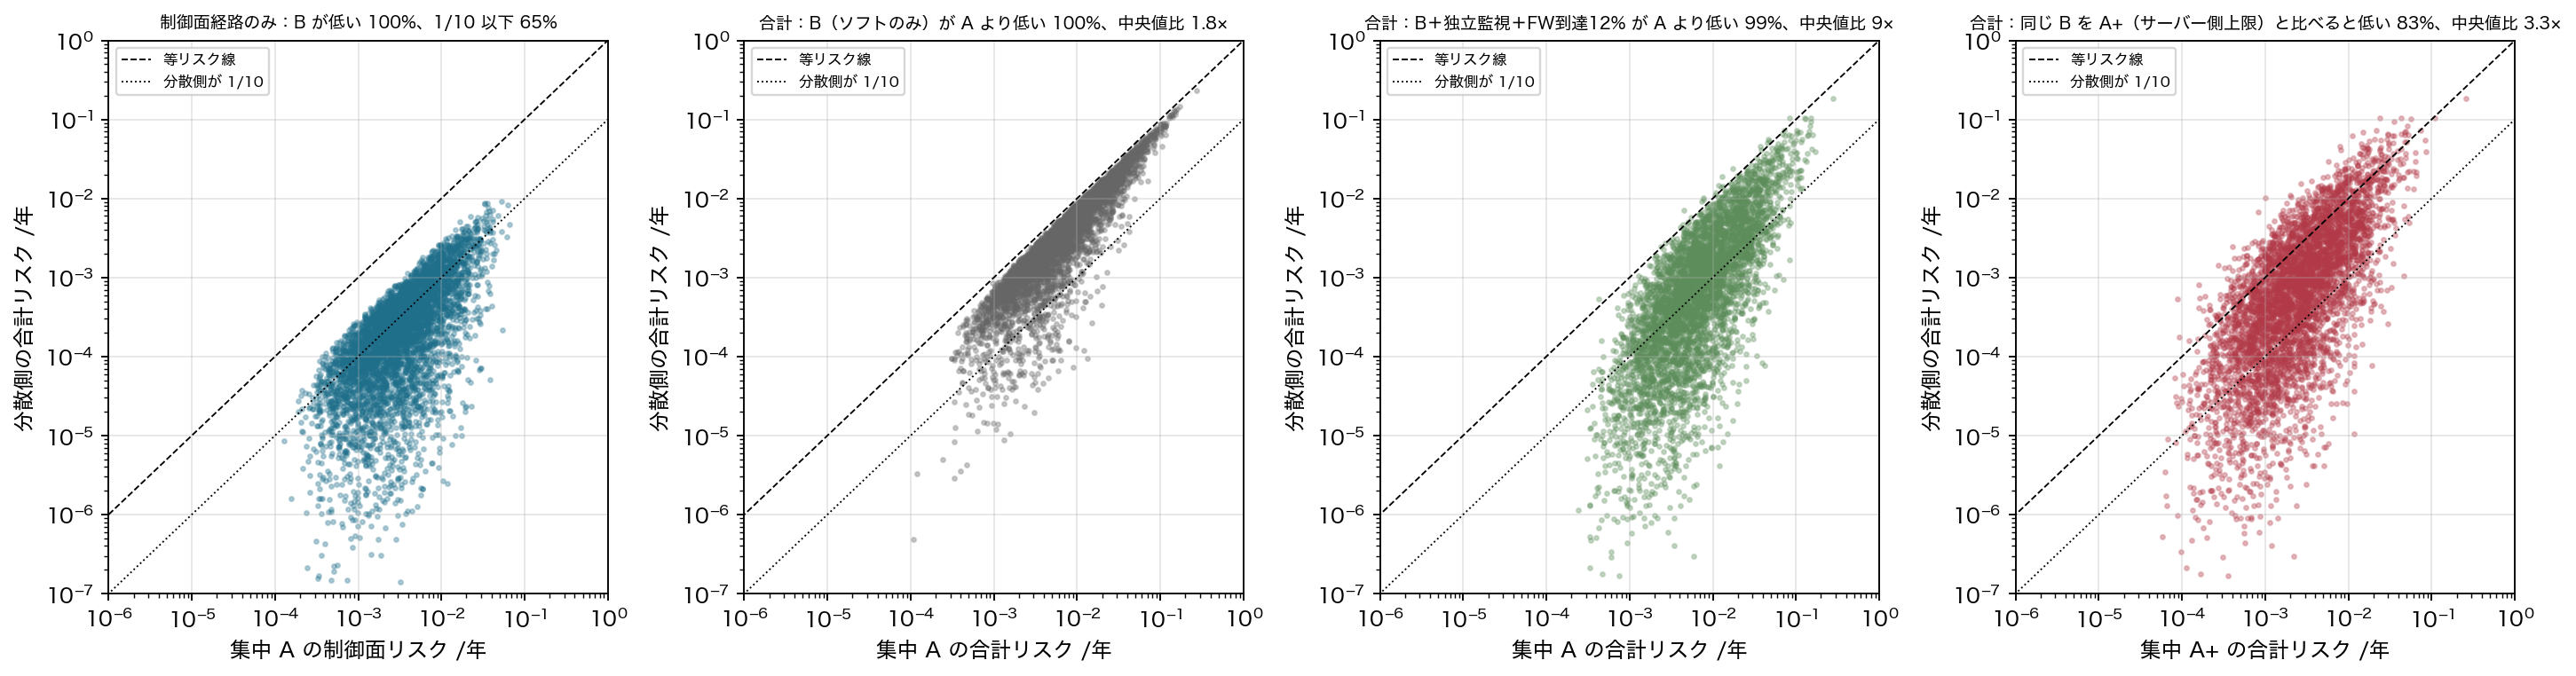
- On the plane channel alone, splitting and the floor work across the whole assumption range, median 1/14.
- In total, software-only B is lower than A but only by a median 1.8×, and loses to A+ two times in three — the vendor channel is identical.
- Bfull is 1/9 of A and 1/3.3 of A+. It loses to A+ in 17% of draws, with a clear profile: relatively likely vendor channel (median p_vendor_rel 0.33), relatively rare backend compromise (0.24), higher inter-domain β (0.12), smaller server-side cap (1,400 MW). A+ wins when the centralized side can strongly protect its server-side cap and the distributed side's vendor channel is relatively weak.
- x > 1 (one compromise exceeds reserves): A plane 99.97%, A+ 19%, B plane 0%; vendor channel 96% for A, B and A+, 32% for Bfull.
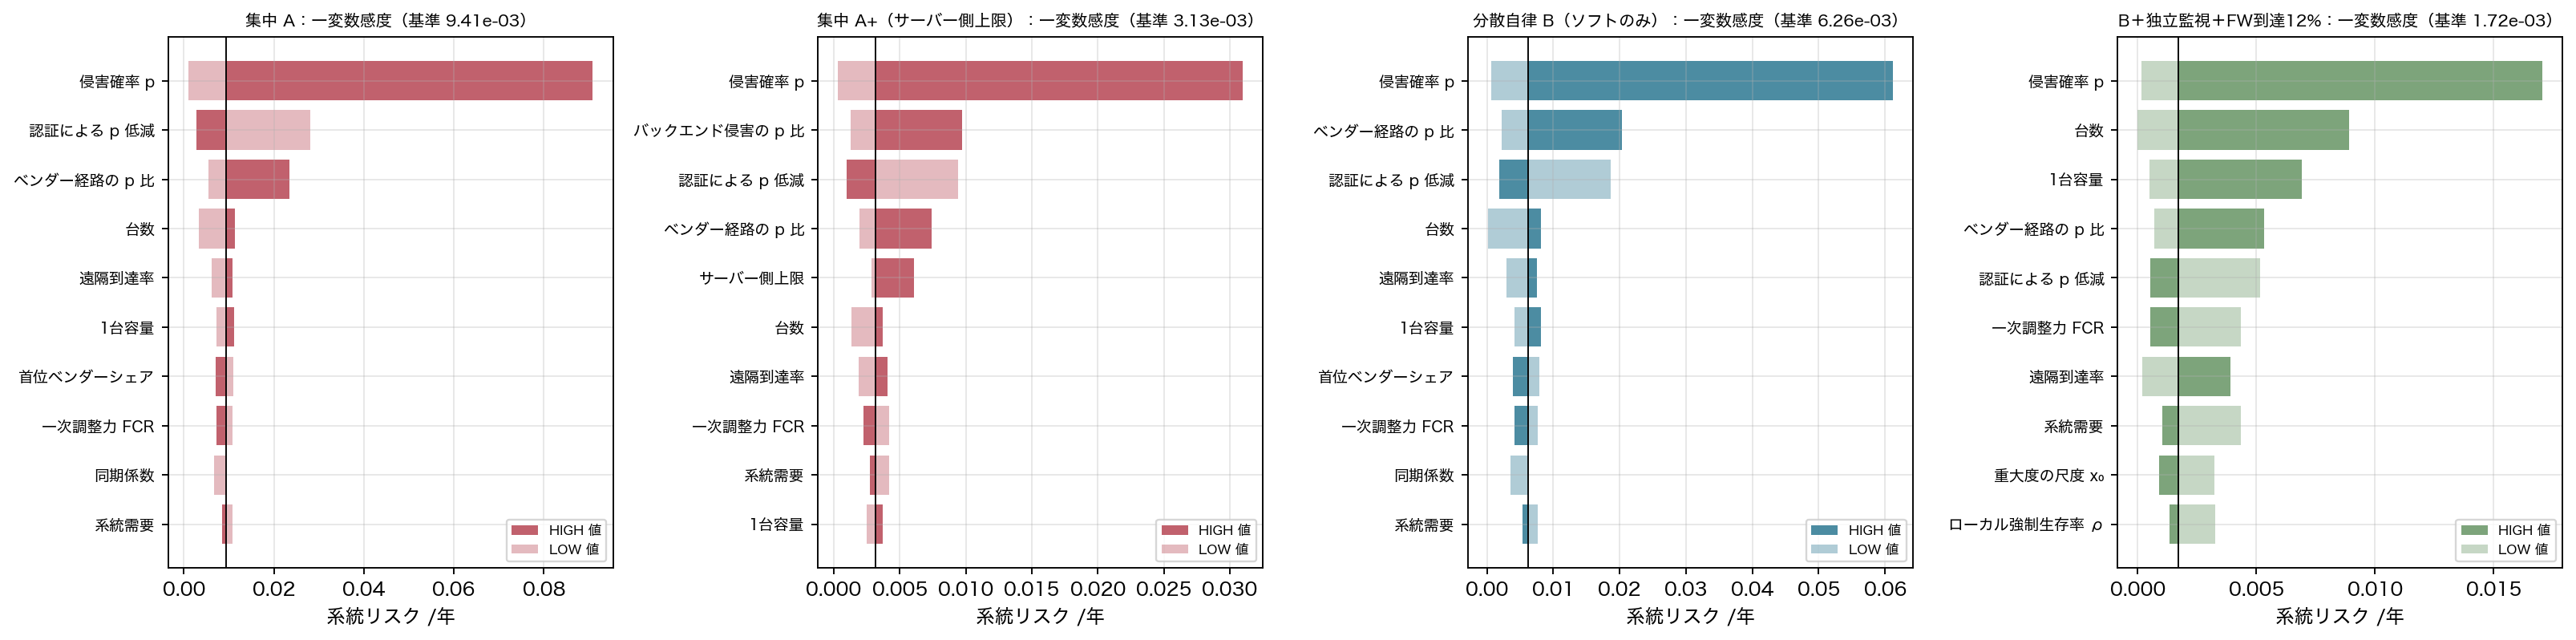
The tornado plots (Figure 9) show that p's range is the largest uncertainty everywhere. A is set by p and the certification factor, saturated against capacity variables. A+ adds the server cap and backend ratio. Software-only B responds to p, the vendor-channel ratio and unit count; domain count and authority cap barely move the total. Bfull responds to the floor, grid size and severity shape.
15. When distributed autonomy loses
The hypothesis must be falsifiable. Conditions under which the model says centralization is safer, or distribution does not function:
- The fleet is small relative to the grid. If x_A < 1, splitting gains little and operational simplicity wins — e.g. 1 GW of DER on a large grid.
- The gain from splitting loses to the multiplied attack surface. n domains cut one Blast Radius to 1/n but multiply compromise opportunities by n. Net gain depends on the convexity of S(x); where x_B is already small, more n brings nothing. Most Monte Carlo cases where A beats B are cases where one B compromise is within reserves but the number of surfaces wins.
- The vendor channel is relatively likely. If firmware-line compromise is as likely as plane compromise, splitting does not lower the total; only the independent-monitor floor and reach cap do.
- The centralized side can protect its server-side cap. With an independent safety monitor and rare backend compromise, A+ lands in Bfull's order and wins on simplicity.
- Firmware is compromised and the floor is software-only. The constraint engine is taken with it (B5a); central detection and mass key revocation may then be faster.
- Domains are not independent. Reused credentials, shared CA, shared operator, shared IdP: splitting is nominal and CBR equals the centralized case (B3, β → 1).
- Recovery. Firmware fixes travel via vendors at the same speed in A and B; key reissue runs in parallel across B's 100 domains; site visits do not depend on structure. We find no basis for order-of-magnitude recovery-time differences, but simultaneous reconnection is a disturbance regardless (Section 17, L5).
- Flexibility value. A 30% floor limits remote reduction to 70%. AEMO's emergency backstop faces the opposite problem — too little remotely reducible capacity [S07]. In Japan the TSO/DSO has the authority and duty to curtail PV to zero (Section 20); the floor's width becomes a quantity agreed with the operator.
- The attacker is on the physical side. Substations and protection relays (Ukraine 2015 [I05], Industroyer2 [I08]) make DER design irrelevant.
- Severity is near-linear. At k = 1 the difference is a ratio, not orders — yet still a 227-fold probability reduction (Figure 6 right).
We do not hide these. Conversely, where they are not met — GW-scale fleets, concentrated credentials, no cap on server or device, firmware lines concentrated in a few vendors — the conclusion applies as stated.
16. Relation to prior work
The structure is not new; we have re-posed prior work with cyber Blast Radius as the objective.
- NERC CIP-002 [I10]: protection tiers by MW per cyber system. CBR's decomposition brings this threshold to distribution-level devices, domains and firmware lines.
- EU NCCS ECII [S05]: a cyber impact index in MW with thresholds at FRR/FCR; the x scale is borrowed here.
- Web-of-Cells (ELECTRA IRP) [W01]: cells own their voltage and frequency; our "domain" is similar but bounded by "credentials do not propagate" rather than electrically.
- National Laboratory of the Rockies (formerly NREL) Autonomous Energy Systems [W02], FAST-DERMS [W03]: hierarchical/federated handling of tens of millions of units; F corresponds to the federated form, adopted partly for security.
- Grid-forming inverters [W04], IEEE 2030.7/1547.4 [S03]: frequency support without communication, survival by islanding.
- Cyber N-1: SOCCA (2015) [W05] and NERC's Cyber-Informed Transmission Planning Framework (2023) [S09] treat "the set of assets one cyber compromise can take out" as a contingency on the transmission side. MadIoT/BlackIoT [R10] and Huang et al.'s rebuttal [R11] debate synchronized demand manipulation.
- Zero Trust [S11] lowers p; the floor lowers CBR. Complementary, not substitutes.
- Normal Accidents [W08]: accidents in tightly coupled complex systems are unavoidable; loosening coupling is the remedy. Floors and caps loosen coupling.
What this article adds: (1) the CIP-002/NCCS threshold logic decomposed to distribution-level DER and devices; (2) plane and vendor channels summed at fleet level per year, showing numerically when splitting does not lower the total; (3) "hardware enforcement" decomposed into implementable elements, with the reach cap computed on the premise that the floor survives and the ramp limit does not; (4) an open model readers can check with their own numbers, with the reviewers' objections and our responses in full.
17. Physics overrides software authority
In one sentence: however large software's authority, physics (frequency, voltage) and an independent monitor must be able to refuse it.
The implementation is a graceful-degradation ladder:
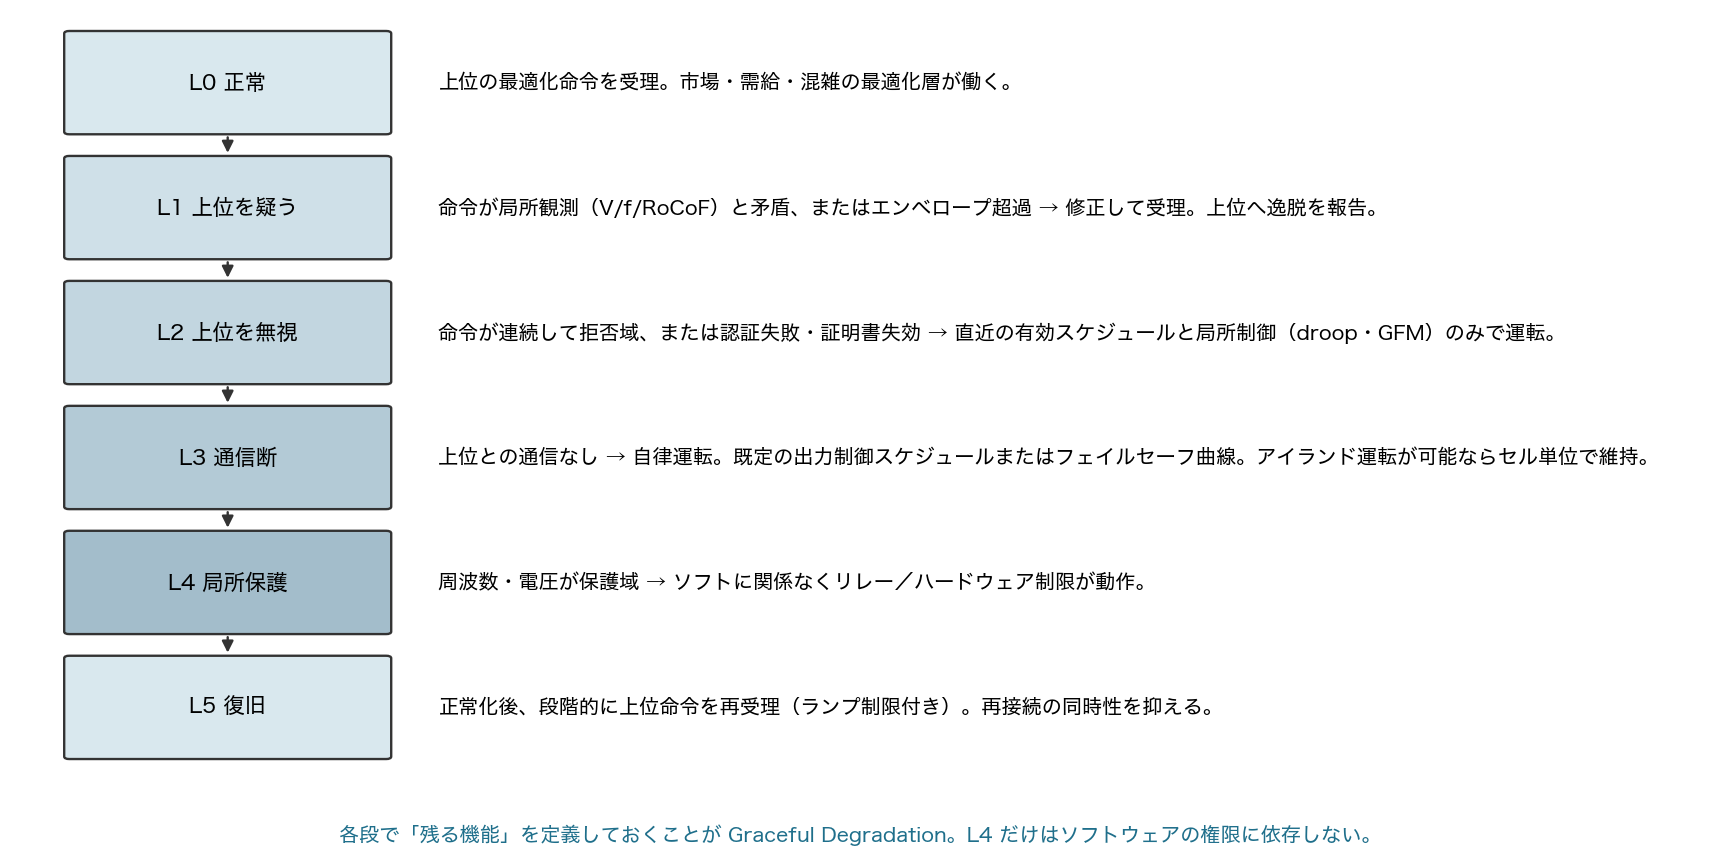
- L0 normal: accept upper-level balancing commands
- L1 doubt the upper level: command contradicts local observation or exceeds floor/ramp → modify and accept, report
- L2 ignore the upper level: repeatedly outside the envelope, or authentication fails → last valid schedule and local control only
- L3 link lost: autonomous operation on the default curtailment schedule; islanding per cell where possible
- L4 local protection: frequency/voltage in the protection band → interconnection relay trips; independent monitor overrides operation below the floor
- L5 recovery: staged re-acceptance of upper-level commands with ramp limits; avoid simultaneous reconnection
L4's two elements do not depend on main-firmware authority: relays can only trip, and the floor is kept by the independent monitor. While both remain, "firmware compromise = total shutdown" does not follow. While the floor lives in the main firmware, B5a's ending is unavoidable.
L5 is easily overlooked. Ten million devices reconnecting at once is the same synchronized change as an attack. IEEE 1547's randomized reconnection delay is the existing answer.
18. Architecture comparison and economics
| Aspect | Centralized (A) | Centralized + server cap (A+) | Hierarchical (H) | Federated (F) | Distributed, software-only (B) | Distributed + independent monitor + reach cap (B6) |
|---|---|---|---|---|---|---|
| Flexibility value | Maximum | High (≤1,500 MW at once) | High | Medium–high | Medium (loses the 30% floor) | Medium |
| Max CBR per compromise: plane | 35,000 MW | 1,050 MW | 3,500 MW | 350 MW | 117 MW | 117 MW |
| Max CBR: largest firmware line | 10,500 MW | 10,500 MW | 10,500 MW | 10,500 MW | 10,500 MW | 1,407 MW |
| Total systemic risk (/yr) | 9.4×10⁻³ (certified) | 3.1×10⁻³ | 1.1×10⁻¹ | 2.2×10⁻² | 1.9×10⁻² (6.3×10⁻³ certified) | 4.0×10⁻³ |
| Expected affected capacity (MW/yr) | 152 | 49 | 455 | 455 | 222 | 152 |
| Behaviour on link loss | Last schedule (common) | Same | Same | Same | Same + local control | Same + local control |
| Common causes | Plane, firmware lines | Backend, firmware lines | Regional planes, firmware lines | Firmware lines | Firmware lines | Firmware lines (capped), monitor-MCU supplier |
| Recovery | Firmware via vendors (common); key reissue at 1 site | Same | 10 sites | 100 sites | 100 sites (parallel) | Same |
| Implementation complexity | Low (centre) / high (scale) | Medium (monitor independence) | Medium | Medium–high | High (device constraint engine) | High + device BOM + new test standards |
Economics, per year, all order-of-magnitude (research/open_problems.md gives bases and ranges):
| Item | Who pays | Annual (50 GW reference fleet) |
|---|---|---|
| Lost flexibility value from a 30% floor | Grid operator, market (ultimately consumers) | 35 GW reach × 70% = 24.5 GW, market participation 10–30% × ¥5,000–10,000/kW·yr ≈ ¥12–74 bn |
| Independent monitor circuit (monitor MCU, independent sensing, override drive) | Device owners (passed through) | ¥1,000–3,000/unit × 200–300 k units/yr ≈ ¥0.2–0.9 bn |
| New test standard and per-model certification | Vendors | No floor/rejection test exists in JIS C 8961/8962, IEC 62109 or IEC 62116; must be created. Millions of yen per model, years of work |
| Operating 100 credential domains (HSM, audit, SOC) | Aggregators | ¥ tens of millions × 100 ≈ ¥ several bn |
| Server-side safety monitor (A+) | DERMS operator | Independent build and run ¥ hundreds of millions to ~1 bn |
| A's expected blackout cost | Society (externalized) | p 0.003–0.01/yr × wide-area blackout cost of several to over ten trillion yen ≈ ¥10–50 bn |
Two readings. First, the floor's lost value and A's expected blackout cost are the same order; economics alone do not settle it, and the draft's "expected loss exceeds added cost" is withdrawn. Second, the cheapest items — the independent monitor circuit and the server-side safety monitor — each cut total risk to a third to a fifth. The floor's width e is the tuning variable between lost value and risk; 30% is only a starting point.
Incidence aligns everyone toward loosening the cap: owners pay for parts, vendors for certification, aggregators for operations, operators in flexibility, while benefits spread thinly over society. No cap emerges voluntarily; it must be written into connection requirements (Section 19).
19. Grid Code 2.0 and new policy KPIs
Today's grid codes specify one device's effect on the grid: ride-through, power factor, ramp rates. Cyber is handled by separate regimes (device certification, security guidelines). On the transmission side CIP-002 and NCCS look at "MW per compromise"; on the distribution side nobody does.
Grid Code 2.0 proposes writing remote-authority caps and device-side floors into connection requirements, with KPIs that are measurable and auditable.
| KPI | Definition | How measured | A | B (software) | B6 |
|---|---|---|---|---|---|
| Cyber Blast Radius (MW) | Largest capacity one compromise can move (plane or firmware line) | Reach register × floor attributes | 35,000 | 10,500 | 1,407 |
| Maximum Remote Authority (MW per credential) | Cap on remote authority per credential/domain | Server-side cap declaration and audit | 50,000 | 500 | 500 |
| Remote reach per firmware line (MW) | Installed capacity reachable through one signing key / OTA path | Per-line capacity register | 15,000 | 15,000 | ≤6,000 (12%) |
| Settings-authority reach (MW) | Capacity behind credentials that can rewrite schedules, protection settings or clocks | Same | 50,000 | 500 | 500 |
| Device-side command rejection (auditable attributes) | Remote-OFF class disabled / independent monitor circuit / OTA path separated | Device label, type test | no/no/no | no/no/no | yes/yes/yes |
| Vendor concentration (HHI, top share) | Concentration of installed-capacity shares | Register | 0.18 / 30% | 0.18 / 30% | ≤0.10 / 12% |
The draft's "Autonomous Survival Time" is removed: running on the last schedule when the link drops is a function Japan's curtailment inverters have in A as well. "Communication independence ρ" cannot be measured by test and is decomposed into three binary attributes.
The firmware-line reach cap is not a vendor market-share cap. A vendor may sell any number of GW; it must split the capacity reachable through one signing key and one OTA path. Nationality-neutral, not a quota. Enforcement needs a per-firmware-line capacity register, which does not exist today.
Connections to existing regimes, item by item:
- Interconnection rules: make floor and rejection behaviour type-test items alongside ride-through and anti-islanding (new test standard needed)
- Curtailment rules: publish TSO/DSO curtailment-server reach per area; impose per-area aggregate caps on the immediate-command path and device-side frequency/voltage checks on the schedule path (Section 20)
- Capacity and balancing market participation: declaration and cap of aggregators' Maximum Remote Authority
- JC-STAR [S08]: add "maximum remote authority (kW)", "remote-OFF class disabled", "independent monitor circuit", "OTA path separated" to the label beside the stars
- EU NCCS ECII [S05]: add device-, domain- and firmware-line-level CBR
- Germany §14a [S06]: apply the floor logic to generation
20. The question for Japan
Japan's grid is split into 50 Hz and 60 Hz areas linked by about 2.1 GW of frequency converters. East Japan effectively shares one frequency. Hokkaido is DC-linked, frequency-independent, and went to blackout in 2018 from a 1,160 MW initial loss.
The question is one:
In Japan, how many GW can one attacker move at once?
Nobody can answer today. Device counts are known; certified counts can be counted. But "how many MW sit behind one credential" and "how many MW does the largest vendor's cloud reach" are not compiled.
The first thing to measure is Japan's largest existing control plane. Online curtailment by TSO/DSOs sends schedules from a per-area command server to capable inverters, which execute them [S12]. It is not a precedent for B. In our classification it is type H — a per-area single control plane, no device floor, authority down to zero — a configuration Section 10 classes as load shedding. In Kyushu, more than half of PV is reduced within tens of minutes on sunny spring days. How many times the area's primary reserve does that server reach? That number is the first CBR.
TSO/DSOs have the authority and duty to curtail; a device design that "rejects" commands conflicts with it. A reconciliation:
- Separate the schedule path from the immediate-command path. Curtailment schedules (next-day hourly output caps) are outside the floor, with per-area aggregate caps and a device-side frequency/voltage check instead (do not execute a scheduled reduction while frequency is low).
- Apply the floor and authority cap to the immediate-command path (balancing market, aggregator DR) — the subject of B.
- Count settings authority. Capacity behind credentials that can rewrite schedules weighs as much as immediate-command CBR: the attacker need not act within the window; writing zero into tomorrow's schedule and cutting the link suffices.
Answering requires:
- Declaration by TSO/DSOs, aggregators and vendors of "remote reach" and "settings-authority reach"
- Registration of device attributes (remote-OFF class disabled, independent monitor, OTA separation)
- Publication of x against each area's primary and secondary reserve
In a Hokkaido-sized grid the same 1,000 devices give an x more than ten times East Japan's (grid_context_cases.csv). Thresholds must be ratios to each area's reserve, not national constants.
21. Relation to RightOS / RightFlow
I-S3 develops a platform (RightOS/RightFlow) that verifies rights and authority at the device. This article's "constraint engine" shares its structure — a device accepting, modifying or rejecting upper-level commands against its own conditions.
But the article does not presuppose the product. The CBR model, the floor and the degradation ladder are design principles valid for any vendor's implementation. Whether I-S3's implementation meets them should be measured by this article's KPIs — above all "independent monitor circuit" and "OTA path separation". A software-only constraint engine, by this article's results, does not lower total risk.
22. Using the simulator: your own numbers
The numbers here are a reference case. Readers' grids, fleets and threat estimates differ. The Cyber Blast Radius Simulator below implements the Python model's equations in JavaScript; change an input and the three columns A, A+ and B update.
Cyber Blast Radius Simulator
Inputs: unit count, average capacity, remote reach, vendor count and top share, independent domains, authority per domain, local autonomy on/off, floor, ramp limit, floor survival, compromise probability, certification factor, relative vendor-channel and backend probabilities, share whose floor survives in an independent monitor, inter-domain β, server-side cap, recovery time, demand, primary and secondary reserve, inertia, severity shape.
Outputs: total capacity, max CBR per compromise (plane, firmware line), x, severity, frequency response (plane and firmware-line compromise), probability of some compromise per year, systemic risk (plane channel, vendor channel, total), expected affected capacity, recovery exposure, HHI.
Python–JavaScript agreement is checked by simulator/parity_test.js on seven cases. Equations, code and the assumptions table are public; disagree with an assumption, change the row and recompute.
23. Falsification conditions and limitations
The claim is wrong if any of the following is shown:
- Severity is nearly flat in x (a grid where ten times the reserve does not lead to shedding); then CBR differences are not risk differences. Consistency with Section 7 would need to be shown.
- Compromise probability differs by orders of magnitude by structure (a central plane 1/1000 as likely as a distributed domain); the break-even could then reverse (Figure 6).
- The independent-monitor floor is unimplementable or bypassable; B5a becomes distributed autonomy's reality, requiring a 3.9% firmware-line reach cap.
- The server-side aggregate cap holds even under backend compromise; A+ is then the cheapest solution.
- A real attack in which a distributed, floor-equipped fleet caused larger grid impact than a centralized one.
Limitations:
- Single-area, frequency-only model: no voltage, flows, protection cascades, emergency transfer via frequency converters, pumped-storage tripping or RoCoF relays. When DER supply 78% of demand (A2), few synchronous machines remain and H = 3.5 s and FCR 3% do not hold. This cuts against A and for B at once, so the magnitude of the difference should be read with a range.
- Severity is a fit to literature points, unidentified below x = 0.5. B's plane-channel absolute value (10⁻⁴ range) depends on k by orders of magnitude; x itself (0.03) is the more accurate reading.
- p is an order-of-magnitude estimate not decomposed into P(vulnerability) × P(exploitation) × P(intent); assuming equal p for small aggregators and large DERMS vendors is coarse.
- Installed-capacity CBR ignores PV availability (60–70% of rating at noon, zero at night): overstated for PV-heavy fleets, fair for batteries, EVs and water heaters.
- The floor e means different things by device type (PV: available output; batteries: charge/discharge point); a uniform 30% is coarse.
- Concentration of independent-monitor MCU suppliers would itself be a new monoculture.
- Only "reduce output" attacks are modelled. Increasing output, oscillating within the floor at the grid's natural frequency, choosing low-inertia hours, spoofing device frequency/voltage measurement or time, rewriting settings/schedules/protection for the next natural disturbance, and attacking simultaneous reconnection are out of scope. Settings-authority reach is proposed as a KPI but not modelled.
- Recovery-time differences, field degradation of ρ (maintenance bypass), rejection-report formats and the absence of test standards are listed as open problems (
research/open_problems.md).
24. Conclusion
Since the probability of a breach cannot be zero, the question moves from "how do we defend" to "what structure do we permit in which N MW move when the defence fails". This article defined that quantity as Cyber Blast Radius and compared centralized control and distributed autonomy against the same attack on the same grid, fleet-wide, across all channels, per year.
The result is more cautious than the draft. For the same control-plane compromise, distributed autonomy turns 35 GW into 117 MW. But once attack surfaces are counted and the shared vendor firmware-line channel is added, software-only distributed autonomy is no safer than centralization. What lowered the total was not the architecture but a cap on the MW behind one credential and one firmware line — on the device side an output floor held by a monitor circuit independent of the main firmware, on the server side an aggregate cap held by an independent safety monitor. The cap can sit on either side. On the device side, B6/B7 are one-half to one-seventh of certified A; on the server side, A+ is one-third; with assumptions varied, either is below A in over nine draws out of ten.
Centralization keeps its advantages where the fleet is small, where the server-side cap can be strongly protected, where the vendor channel is relatively weak, and where flexibility value must be maximised. On economics, the floor's lost value and the expected blackout cost are the same order; nothing is settled there.
Still, for the real structure — GW-scale fleets behind one credential and a few firmware lines, with no cap on server or device — the conclusion does not move. However far probability is lowered, the consequence of a structure that can move 35 GW does not change. Only a cap on authority changes it.
The secure grid is not the grid that can never be hacked. It is the grid that continues to function when something is hacked.
One question remains: in Japan, how many GW can one attacker move at once? Measuring it, publishing it, and capping it is the next step.
Citation and reuse
Of the attachments, the CSV, JSON, Python and JavaScript files (data/, model/, simulator/, results/*.csv, *.json) are released under CC BY 4.0. Cite I-S3 Co., Ltd. and this article's URL and you may reuse, modify and redistribute them, including commercially. If you publish results recomputed with different assumptions, please keep the attribution to the original model.
Text and figures (PNG) may be quoted with attribution. For wholesale reproduction of figures, or if you hold different data or assumptions, use the contact form; we will recompute and append how the results change.
When citing "the I-S3 Cyber Blast Radius model", please give the version (1.0) and the base values in data/assumptions.csv; other base values give other numbers.
Suggested citation
English
Masuda, S. (2026). From Cybersecurity to Cyber-Resilience: How to Connect Tens of Millions of DER in a World That Cannot Be Fully Defended. I-S3 Co., Ltd. https://www.i-s3.com/cyber-resilience-der-blast-radius-en.html
Japanese
益田周防海(2026)「CybersecurityからCyber-Resilienceへ——完全には守れない世界で、数千万台の分散電源をどう接続すべきか」株式会社I-S3、2026年10月7日公開、https://www.i-s3.com/cyber-resilience-der-blast-radius.html
BibTeX
@misc{masuda2026cbr,
  author = {Masuda, Suomi},
  title  = {From Cybersecurity to Cyber-Resilience: How to Connect Tens of Millions of DER in a World That Cannot Be Fully Defended},
  year   = {2026},
  publisher = {I-S3 Co., Ltd.},
  url    = {https://www.i-s3.com/cyber-resilience-der-blast-radius-en.html},
  note   = {Japanese original: https://www.i-s3.com/cyber-resilience-der-blast-radius.html. Model, data and code (CC BY 4.0): https://www.i-s3.com/cyber-resilience-der-blast-radius.html#assets}
}
Key files for recomputation
data/assumptions.csv— Assumptions LOW/BASE/HIGH with sourcesdata/incidents.csv— Cyber incidents and reference grid eventsresults/architecture_comparison.csv— Architecture comparisonresults/attack_scenarios.csv— Attack scenario frequency responsesresults/monte_carlo_summary.json— Monte Carlo summaryresults/policy_kpis.csv— Policy KPIsmodel/cbr_model.py— CBR modelmodel/grid_sim.py— Grid simulationsimulator/cbr_core.js— JavaScript model
Reproduce: python3 model/cbr_model.py && python3 model/grid_sim.py && python3 model/correlated_failure.py && python3 model/monte_carlo.py && python3 model/make_figures.py && node simulator/parity_test.js (README).
Change log
- 7 October 2026: version 1.0 published (after a nine-perspective red team review).
Attachments
The files below are generated with the same assumptions and calculations as the text; use them to check numbers or recompute.
Assumptions and data
data/assumptions.csv— 全変数の LOW/BASE/HIGH と出典data/incidents.csv— サイバー事例と参照事故:潜在容量と顕在化した影響data/der_fleet_japan.csv— 日本の DER 規模(PV・PCS・蓄電池・EV・出力制御)
Model (Python 3, numpy, matplotlib)
model/cbr_model.py— CBR 分解・系統リスク・損益分岐・政策 KPI・JS 一致テスト用ケースmodel/grid_sim.py— 単一エリアのスイング方程式による攻撃シナリオmodel/correlated_failure.py— 共通原因故障(β ファクタ)とベンダー多様性のモンテカルロmodel/monte_carlo.py— 全パラメータ同時サンプリングと一変数感度model/make_figures.py— 図 1〜12 の生成
Results (CSV / JSON)
results/architecture_comparison.csv— 14 構成の CBR・x・重大度・系統リスク(制御面経路/ベンダー経路/合計)results/attack_scenarios.csv— 攻撃シナリオ A1〜B5d の周波数応答(ステップ/ランプ分離)results/break_even_grid.csv— 確率低減 × Blast Radius 倍率の損益分岐results/required_p_reduction_by_k.csv— 重大度指数 k ごとの必要確率低減results/ccf_fleets.csv— 共通原因故障モンテカルロのフリート別裾results/ccf_vendor_sweep.csv— ベンダー数と調整力超過確率results/monte_carlo_summary.json— モンテカルロ要約results/tornado_A.csv— A の一変数感度results/tornado_Aplus.csv— A+ の一変数感度results/tornado_B.csv— B(ソフトのみ)の一変数感度results/tornado_Bfull.csv— B+独立監視+到達上限の一変数感度results/vendor_share_limit.csv— ファームウェア系統あたりの到達上限(3 ケース)results/policy_kpis.csv— 政策 KPI の基準値results/parity_cases.json— JS シミュレータとの一致テスト用ケース
Simulator
simulator/cbr_core.js— Python と同じ式の JavaScript 実装simulator/simulator.js— 記事内シミュレータの UIsimulator/parity_test.js— Python との数値一致テスト(node)
Research notes and review
research/grid_sensitivity_calibration.md— 重大度関数の較正点と限界research/prior_art_and_regulation.md— 先行研究・規格・規制の調査メモresearch/jc_star_and_japan_context.md— JC-STAR と日本固有の文脈review/red_team_report.md— 9 視点の Red Team 報告review/final_response_matrix.md— 指摘への応答と反映research/open_problems.md— 未解決の研究課題
Text and summaries
article/index.md— 本記事の Markdown 原稿(日本語)article/index.en.md— English version (Markdown)briefs/executive_summary.ja.md— エグゼクティブサマリー(日本語)briefs/executive_summary.en.md— Executive summary (English)briefs/faq.md— FAQbriefs/researcher_media_brief.md— 研究者・メディア向けブリーフarticle/references.md— 出典一覧README.md— 再現手順とライセンス
References
ID は本文・data/assumptions.csv・data/incidents.csv から参照する。I=事例、R=事故報告・研究、S=規格・規制、W=アーキテクチャ・理論の先行研究、J=日本のDERデータ、D=仮定表の根拠。アクセス日は特記なき限り 2026-10-06。
I. サイバー事例
- [I01] Bitdefender Labs, "60 Hurts per Second – How We Got Access to Enough Solar Power to Run the United States" (2024-08-07). Solarman/Deye クラウドの JWT 未検証・ハードコード資格情報・アカウント乗っ取り。プラットフォーム規模:発電所 200 万件超、機器 1,000 万台、約 195 GW。開示後に修正。 https://www.bitdefender.com/en-us/blog/labs/60-hurts-per-second-how-we-got-access-to-enough-solar-power-to-run-the-united-states
- [I02] Forescout Vedere Labs, "SUN:DOWN – Destabilizing the Grid via Orchestrated Exploitation of Solar Power Systems" (2025-03). Sungrow・Growatt・SMA の 46 件の脆弱性。クラウドアカウント乗っ取りからインバータ遠隔制御まで。各社の累積出荷 Sungrow 740 GW・Growatt 300 GW・SMA 132 GW を引用。 https://www.forescout.com/research-labs/sun-down/
- [I03] Deye(寧波徳業)米国向けインバータの遠隔無効化(2024-11-15)。ベンダーのバックエンドが地域判定で機器を停止。攻撃ではなくベンダー自身の権限行使。 PV Magazine USA, "Deye inverters disabled remotely…" (2024-11-20)。
- [I04] Contec SolarView Compact 乗っ取り(2024-05 報道、三菱電機系・約 800 台)。インターネット露出した太陽光監視装置が銀行不正送金の踏み台に。制御機能はなく系統影響なし。 CVE-2022-29303 ほか。
- [I05] SANS ICS / E-ISAC, "Analysis of the Cyber Attack on the Ukrainian Power Grid" (2016-03-18)。2015-12-23、3 配電会社・約 30 変電所・約 22.5 万需要家が 1〜6 時間停電。遠隔から遮断器を操作、SCADA を破壊し手動復旧。
- [I06] Reuters, "Rogue communication devices found in Chinese solar power inverters" (2025-05-14)。文書化されていない携帯通信モジュール。権限範囲は非公開。
- [I07] CrowdStrike, "Preliminary Post Incident Review" (2024-07-24)。信頼済み更新チャネルによる約 850 万台の Windows 同時停止。エネルギー分野ではないが共通原因の典型。
- [I08] ESET Research / CERT-UA, "Industroyer2: Industroyer reloaded" (2022-04-12)。ウクライナの変電所を標的にした IEC 104 プロトコル対応マルウェア。2016 年の Industroyer(CrashOverride)に続く、電力制御系を直接狙った攻撃。
- [I09] CISA / NSA / FBI, "PRC State-Sponsored Actors Compromise and Maintain Persistent Access to U.S. Critical Infrastructure" (AA24-038A, 2024-02-07)。Volt Typhoon による米国の電力・水道など重要インフラ IT 環境への事前侵入。「攻撃者が電力系統を目標にしていない」とは言えない根拠。
- [I10] NERC, CIP-002-5.1a "BES Cyber System Categorization" Attachment 1。一つの BES サイバーシステムが制御する発電 1,500 MW 以上を Medium Impact、3,000 MW 以上の制御センターを High Impact とする閾値(2013 年版から)。本稿の A+ のサーバー側上限 1,500 MW はこの Medium 閾値に合わせた。
R. 事故報告・系統研究
- [R01] 電力広域的運営推進機関(OCCTO)「平成30年北海道胆振東部地震に伴う大規模停電に関する検証委員会 最終報告」(2018-12)。需要 3,090 MW、苫東厚真 2・4 号機停止で約 1,160 MW 喪失、UFR 1,300 MW 作動、周波数 46.13 Hz、追加脱落でブラックアウト。
- [R03] UCTE, "Final Report – System Disturbance on 4 November 2006" (2007-01)。送電線遮断からの連鎖で欧州系統が 3 分断、約 1,500 万世帯が停電。
- [R04] ENTSO-E, "Final Report on the Iberian Peninsula Blackout of 28 April 2025" (2026-03-20)。過電圧連鎖、2.5 GW 超の発電脱落、サイバー原因なし。
- [R05] AEMO, "Black System South Australia 28 September 2016 – Final Report" (2017-03)。9 風力発電所の耐故障設定(ソフトウェア設定)が共通原因となり 456 MW 喪失→連系線脱落→州全体停電(1,826 MW)。
- [R06] SolarPower Europe / DNV, "Solar Cybersecurity: Protecting Europe's Energy Future" (2025-04)。欧州 PV 269 GW、3 GW 超の製造者 12 社超、「3 GW=制御予備力の閾値、10 GW=連鎖の臨界閾値」、フランス 2023 年 2.66 GW 喪失で 49.88 Hz・負荷遮断なし、リレー保護装置の推奨、リトアニア法 Art.733。
- [R07] Rijksinspectie Digitale Infrastructuur (RDI), "Onderzoek omvormers zonnepanelen" (2023-08)。試験した 9 機種のインバータが全てサイバー要件を満たさず。ローカル強制の信頼性 ρ を 1 未満に置く根拠。
- [R08] ENTSO-E, "Frequency Stability Evaluation Criteria for the Synchronous Zone of Continental Europe" (2016) および P. Kundur, Power System Stability and Control (1994)。慣性定数 H、一次調整の遅れ、負荷の周波数特性。
- [R09] A. Dabrowski, J. Ullrich, E. Weippl, "Grid Shock: Coordinated Load-Changing Attacks on Power Grids" (ACSAC 2017)。参照事故の 1.5 倍の同時変化で 49 Hz 以下(UFLS 域)。重大度関数の較正点。
- [R10] S. Soltan, P. Mittal, H. V. Poor, "BlackIoT: IoT Botnet of High Wattage Devices Can Disrupt the Power Grid" (USENIX Security 2018)。高出力 IoT の同期操作(MadIoT)。攻撃者が同期係数を 1 に近づけられる根拠。
- [R11] B. Huang, A. Cardenas, R. Baldick, "Not Everything is Dark and Gloomy: Power Grid Protections Against IoT Demand Attacks" (USENIX Security 2019)。既存の保護・予備力で MadIoT 型攻撃の多くは吸収されるという反論。
- [R12] 国際エネルギー機関(IEA), "Electricity 2025"。日本・欧州の需要・予備力の規模感。
- [R13] 電力広域的運営推進機関(OCCTO)「令和4年3月16日福島県沖地震に伴う電力需給・系統運用の検証」(2022)。東日本で約 6 GW 超の電源が脱落、東京・東北エリアで周波数低下リレー(UFR)が動作し約 2 GW 強の負荷を遮断。崩壊には至らず 3 時間程度で復旧。「負荷遮断はあったが広域停電ではない」事例。
- [R14] 東京電力「東北地方太平洋沖地震後の電力需給」(2011) および OCCTO 前身の電力系統利用協議会資料。2011-03-11 地震直後に東京エリアで複数電源が脱落し、UFR 動作と系統分離で崩壊を回避、その後計画停電。定量較正ではなく「UFLS が働いた大規模脱落」の定性事例として参照。
S. 規格・規制
- [S01] IEEE Std 1547-2018, Standard for Interconnection and Interoperability of DER with Associated Electric Power Systems Interfaces。§10.9:サイバーセキュリティの重要性は認めるが要件は定めない。
- [S02] IEEE Std 1547.3-2023, Guide for Cybersecurity of DER Interconnected with Electric Power Systems(ガイド、要件ではない)。
- [S03] IEEE Std 2030.7-2017(マイクログリッド制御器)、IEEE Std 1547.4-2011(意図的アイランド運転)、IEEE Std 2800-2022(送電接続 IBR)。
- [S04] IEC 61508-6:2010 Annex D(共通原因故障の β ファクタ 0.5〜10%)、US NRC NUREG/CR-5485 (1998) "Guidelines on Modeling Common-Cause Failures in PRA"。
- [S05] Commission Delegated Regulation (EU) 2024/1366(Network Code on Cybersecurity, NCCS)および ENTSO-E/EU DSO Entity "Provisional ECII values" (2024-11)。高影響閾値 250〜1,500 MW(=各国 FRR 最小量)、重大閾値 3,000 MW(=FCR)。例:ドイツ 1,500 / 3,000 MW。
- [S06] ドイツ エネルギー事業法 §14a EnWG と BNetzA 決定 BK6-22-300 (2023-11-27)。2024-01-01 以降、制御可能な消費機器は最低 4.2 kW(11 kW 以上は 40%)まで低減可・完全遮断不可・最長 2 時間。
- [S07] AEMO, "Emergency backstop mechanism" 関連文書 (2023–2025)、CSIP-AUS(通信断時の既定動作要件)。南オーストラリアで約 857 MW の制御可能量が必要に対し約 780 MW。
- [S08] IPA「セキュリティ要件適合評価及びラベリング制度(JC-STAR)」(2025-03 開始) および Commission Delegated Regulation (EU) 2022/30(RED 無線機器サイバー要件、2025-08-01 適用)。「認証で侵害確率が下がる」主張の対象。
- [S09] NERC, "Cyber-Informed Transmission Planning Framework" (2023)。送電計画にサイバー起因の多重事故(N-k)を組み込む枠組み。
- [S10] リトアニア共和国法 Art.733(2025 改正)。100 kW 超の太陽光設備に対する「安全保障上の脅威と認定された国」からの遠隔アクセスを禁止。
- [S11] NIST SP 800-207, Zero Trust Architecture (2020)。
- [S12] 資源エネルギー庁「オンライン代理制御・出力制御機能付 PCS」要件 (2022-04 以降の新規低圧 10 kW 以上に義務)、JEMA「出力制御機能付 PCS の仕様」。固定/更新スケジュール、通信断時は最後の有効スケジュールで運転。
- [S13] 経済産業省「電力分野のサイバーセキュリティ対策」、電力 ISAC「電力制御システムセキュリティガイドライン」。
- [S14] NERC CIP-002〜014 Reliability Standards(北米 BES サイバーセキュリティ、15 MW 等の対象閾値)。
W. アーキテクチャ・理論の先行研究
- [W01] L. Martini et al., "The ELECTRA IRP Web-of-Cells Control Architecture…" (AEIT 2018); ELECTRA IRP D6.3 (2017)。セル単位の電圧・周波数制御。
- [W02] National Laboratory of the Rockies(旧 NREL、2025-12 改称), "Autonomous Energy Systems" (NREL/TP-5D00-82922, 2022 ほか)。数千万台の制御を階層的・分散的に扱う研究プログラム。
- [W03] NREL, "FAST-DERMS: Federated Architecture for Secure and Transactive DER Management Systems" (OSTI 2583470, 2024)。連邦型 DERMS。
- [W04] NERC, "White Paper: Grid Forming Technology" (2021); UNIFI Consortium, "Specifications for Grid-Forming IBRs v3" (2025)。
- [W05] K. Davis et al., "SOCCA: A Security-Oriented Cyber-Physical Contingency Analysis in Power Infrastructures" (IEEE Trans. Smart Grid 2015)。サイバー起因の多重事故評価=「Cyber N-1」の先行例。
- [W06] S. Sridhar, A. Hahn, M. Govindarasu, "Cyber–Physical System Security for the Electric Power Grid" (Proc. IEEE 2012)。
- [W07] D. Geer et al., "CyberInsecurity: The Cost of Monopoly" (CCIA 2003)。ソフトウェア単一文化が系統的リスクになるという最初期の主張。
- [W08] C. Perrow, Normal Accidents (1984)。密結合・複雑系の事故は避けられず、結合を緩めることが対策になる。
- [W09] 欧州委員会 JRC, "Cyber Resilience of the European Power Grid" (2023)。レジリエンスとセキュリティの区別。
- [W10] P. Hines, E. Cotilla-Sanchez, S. Blumsack, "Do topological models provide good information about electricity infrastructure vulnerability?" (Chaos 2010)。
- [W11] IEA, "Power Systems in Transition – Challenges and opportunities ahead for electricity security" (2020)。サイバーレジリエンスの章。
- [W12] 本サイト関連記事:「ローカル自律優先の系統アーキテクチャ」「分散エネルギーのレジリエンスと自律ノード」「エネルギー安全保障の偽りの安全」「認証済み機器 ≠ 安全」「JC-STAR 論点整理」(記事末のリンク)。
J. 日本の DER データ
- [J01] 太陽光発電協会(JPEA)「日本の太陽光発電の導入量」(2025)、環境エネルギー政策研究所(ISEP)推計。累積 100 GW 超、年間導入 5〜6 GW。
- [J02] 日本電機工業会(JEMA)「太陽光発電用パワーコンディショナ 出荷統計」2025 年度上期:住宅用 187,330 台。
- [J03] 資源エネルギー庁 / 国土交通省、戸建住宅の太陽光設置率(約 10%、約 340 万件規模)。
- [J04] 経済産業省「充電インフラ整備促進に向けた指針」(2023) と公共充電口数(約 4 万口、2025)。
- [J05] JEMA「定置用リチウムイオン蓄電システム 出荷実績」累積約 100 万台。
- [J06] 資源エネルギー庁「出力制御の対象拡大とオンライン化」(2022)。
- [J07] OCCTO「電力需給検証報告書」各年度、エリア別最大需要。
D. 仮定表(assumptions.csv)の根拠
- [D01] 台数:J02・J03・J05 と 2030〜2040 年の EV/EVSE・ヒートポンプ普及見通し(資源エネルギー庁 第 7 次エネルギー基本計画)。
- [D02] 1 台容量:住宅 PCS 4〜6 kW、家庭用蓄電池 3〜6 kW、普通充電 3〜6 kW、HP 1〜3 kW の加重平均。
- [D03] 遠隔到達率:I01 のプラットフォーム接続率、S12 のオンライン化率(新規は義務、既設は任意)、常時接続でない機器。
- [D04] ベンダー集中:R06(欧州 12 社超が各 3 GW 超)、国内住宅 PCS 市場の上位集中(業界統計)。
- [D05] ドメイン数の定義:認証情報・鍵・テナント・配信系統が互いに独立な制御単位。運用上の「地域」ではなく「侵害が伝播しない境界」で数える。
- [D06] 系統需要:J07(東日本 50 Hz 系統の中間期昼間 40〜55 GW)。
- [D07] 予備力:S05(FCR 3,000 MW ≈ 大陸欧州需要の約 1%、ただし日本は単一エリアで需要比が大きい)、OCCTO「調整力の必要量」。
Suomi Masuda / I-S3 Co., Ltd. Based on public sources and an open model. Not advice for a specific system design or investment.